- 30 Oct 2024
- 3 Minutes to read
- Print
- DarkLight
- PDF
Cluster Wheel
- Updated on 30 Oct 2024
- 3 Minutes to read
- Print
- DarkLight
- PDF
The Cluster Wheel is an interactive data visualization designed to organize and present large volumes of unstructured data for analysis. Documents or content records are grouped together based on their lexical similarity or vocabulary used within the record. Each document group or Cluster includes a set of themes which describe the overall subject matter of the document group. These Cluster Themes can be used to quickly understand the nature of a set of documents or content records without having to read individual documents within the Cluster.
Exploring the Cluster Wheel
To explore a data set using the Cluster Wheel, follow the steps below:
Click on the Analytics tab and then click on the Cluster Wheel tab within the navigation menu in the upper left-hand corner of the screen.
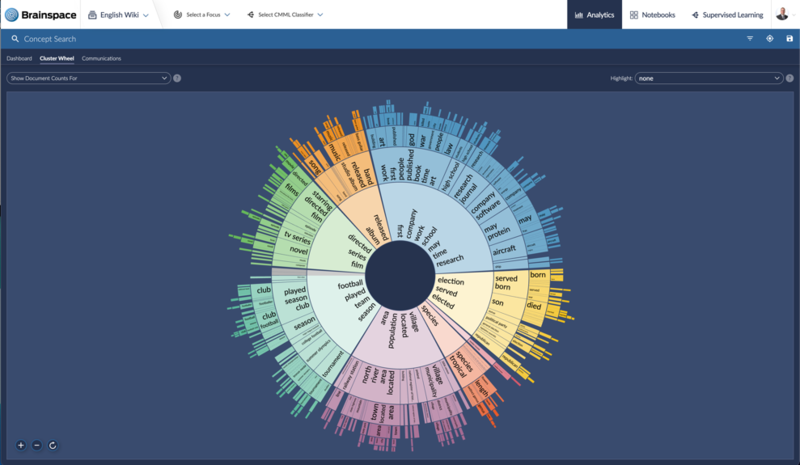
Identify an area of the wheel to explore and click on the first cluster with themes that appear to be relevant to what you’re looking for.
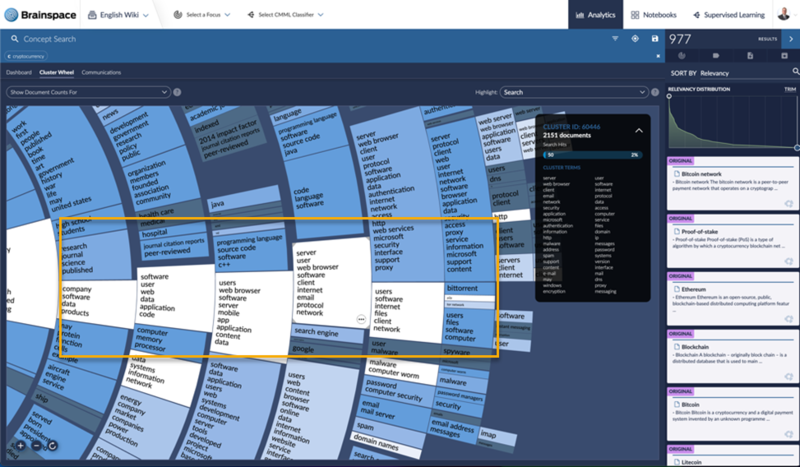
As you identify clusters of interest, you can click on the ellipsis icon in the lower right-hand corner of the cluster and then click on Add to Search to retrieve the documents or content records from that cluster.
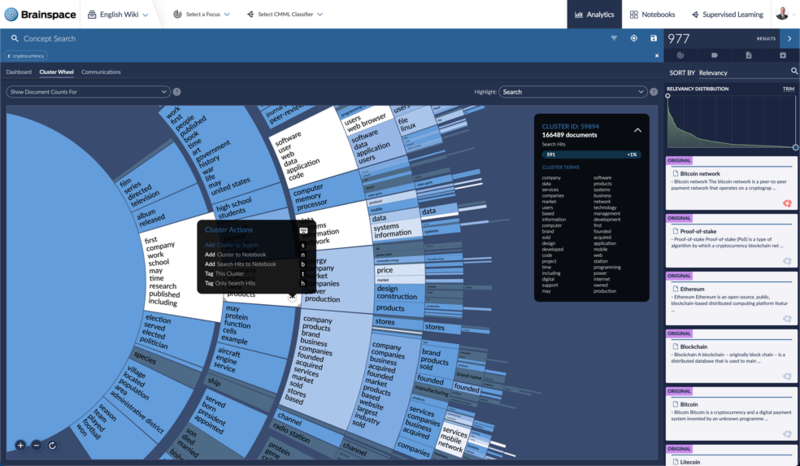
You can then open each document or content record located on the right-hand side of the screen. You have the option of reviewing the documents to confirm relevance, apply tags to documents, or adding sets of documents to a Notebook for downstream workflows.
You have the option of resetting the Cluster Wheel back to its original state at any time by clicking on the semi-circle arrow icon in the lower left-hand corner of the screen. You can also use the + and – icons to zoom in and zoom out of the visualization while you’re exploring the clusters.

Searching the Cluster Wheel
To perform a Concept Search against using the Cluster Wheel, follow the steps below:
Enter a concept or term in the Concept Search bar at the top of the screen.

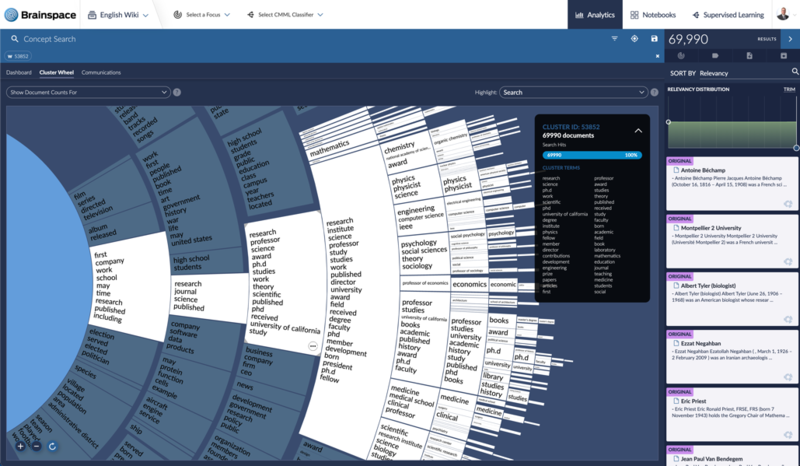
The Cluster Wheel will automatically update the color scheme to show where the search hits are located within the visualization. Color shading is used to show where the search hits are located. Lighter shaded clusters have a higher concentration of hits and darker shaded clusters have a lower number of search hits. In this example, we searched for the term “cryptocurrency” and we can see which clusters contain the most hits.
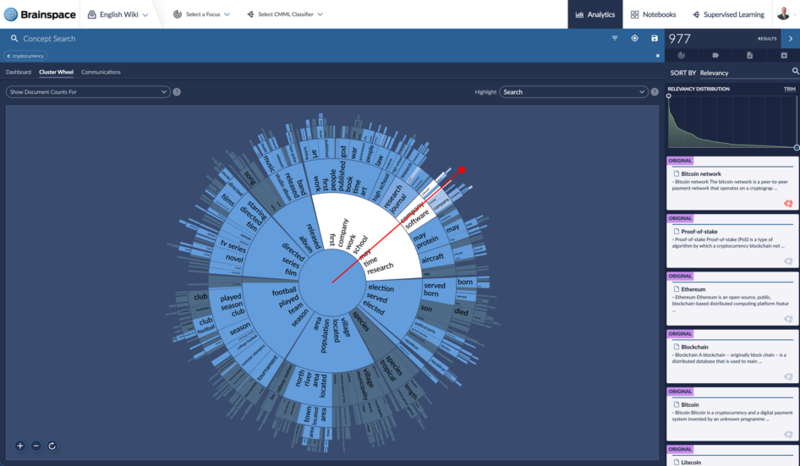
After reviewing your search hits, you have the option of retrieving documents from a specific cluster. When reviewing documents within a cluster, you can click on the Cluster Wheel icon in the lower right-hand corner of the document card to see where the document exists on the Cluster Wheel. Brainspace will draw a red line to the outer edge of the wheel and display a red dot where the document is located.
When selecting a specific cluster, the Cluster Card is displayed showing you the full list of themes (or Cluster Terms) associated with the cluster along with the Cluster ID.
In addition to performing a Concept Search against the Cluster Wheel, you can also view where tagged documents exist within the various clusters. Similar to Concept Search, Brainspace uses color shading (light and dark) to highlight where tagged documents exist within the Cluster Wheel. To view tagged hits on the Cluster Wheel, click on the Highlight dropdown menu in the upper right-hand corner of the Cluster Wheel and then select the appropriate tag/choice combination. Here’s an example of where documents tagged with Alien: Negative are located within the visualization.
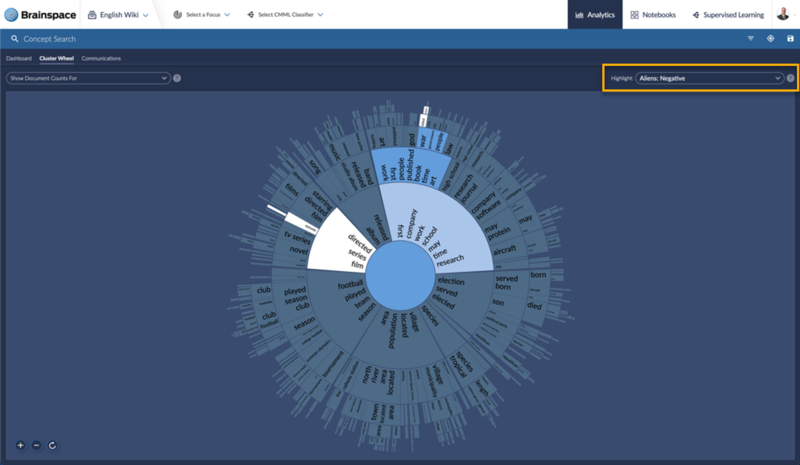
When you select a cluster that includes search hits from your tag/choice selection and then select your tag/choice combination from the Show Document Counts For dropdown menu in the upper left-hand side of the screen, the Cluster Card will display and present you with the number and percentage of documents that were tagged with that selected tag/choice combination.
| |
.png)


