- 17 Oct 2024
- 2 Minutes to read
- Print
- DarkLight
- PDF
Data Visualization
- Updated on 17 Oct 2024
- 2 Minutes to read
- Print
- DarkLight
- PDF
Data visualization allows you to quickly understand the types of documents available in your case.
How to Access Data Visualization
The Results View icon is located in the upper right corner of your screen. Click the down arrow to access the view options.

Select Charts view under Results Summary.
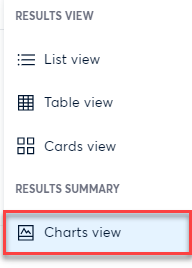
Charts View Interface
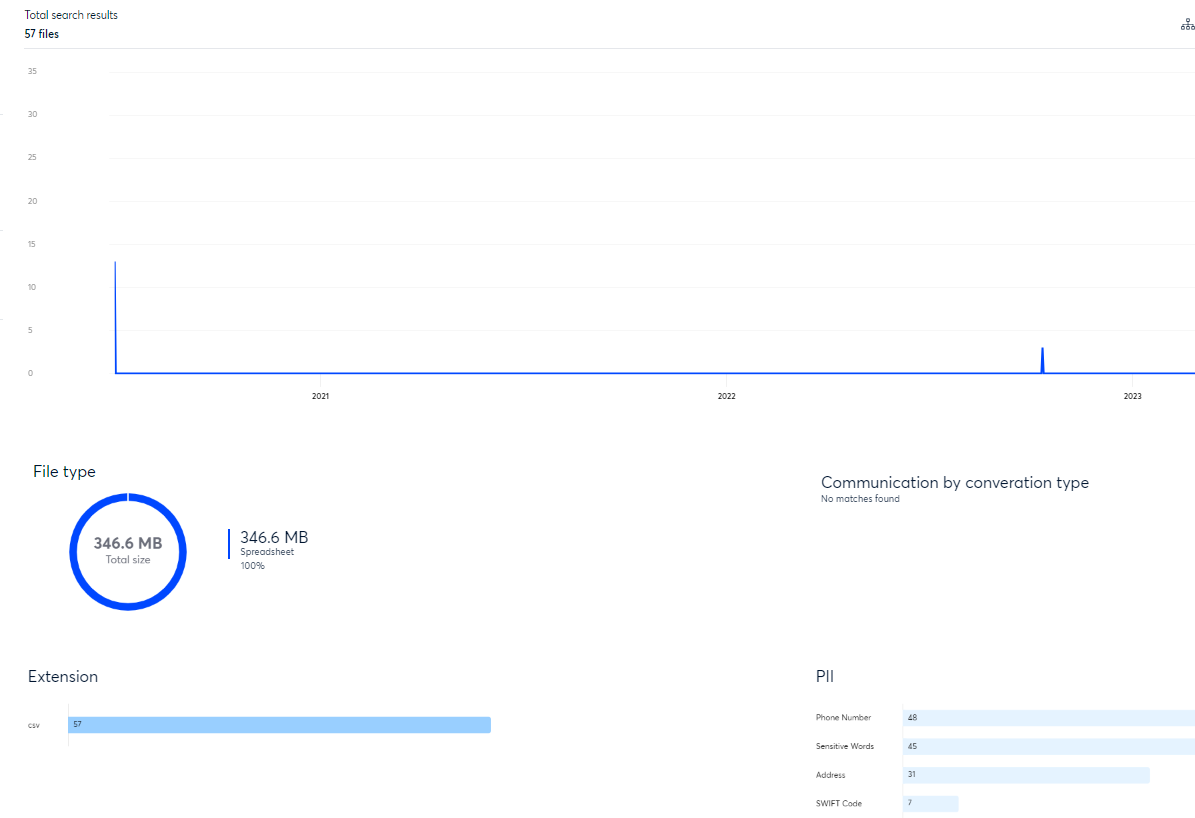
There are five classifications that can be used to refine your data. Each classification will be discussed in detail below.
Date Graph
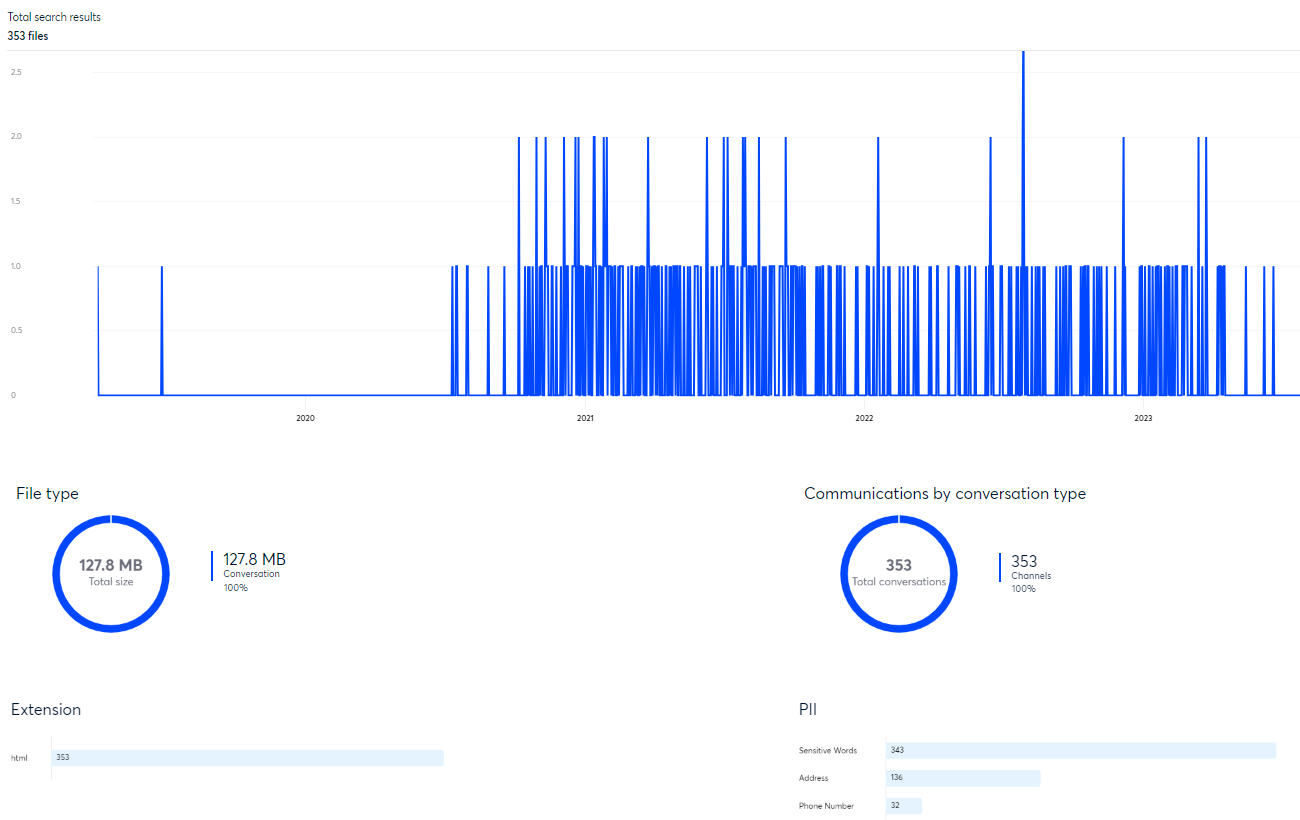
The Date graph allows you to create specific timelines.

Click the down arrow beneath Period of time to choose a time frame or create your own custom date line.

As you hover along the dates on the graph, the document date and totals will appear.
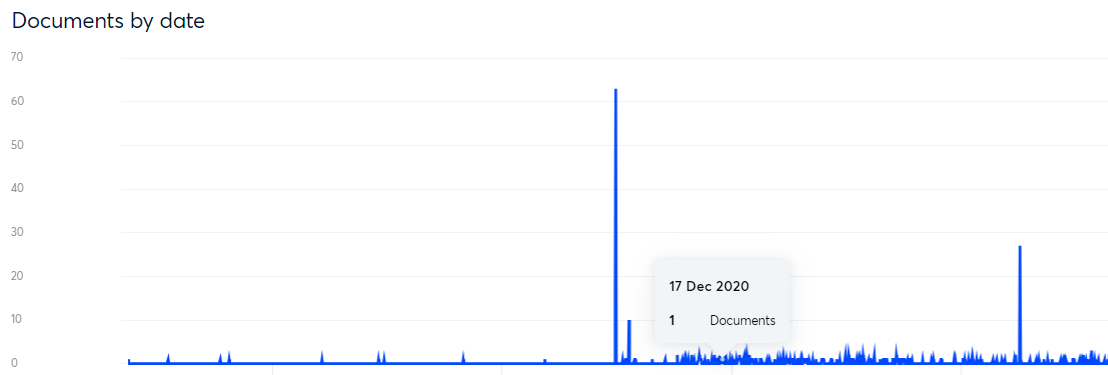
If you change the time frame, the total search result number will change to reflect the dates chosen.
File Type
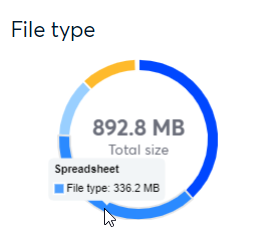
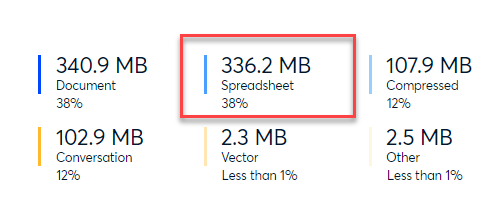
The pie chart found under File type will display the overall size of your files along with the different file categories.

As you hover over each section, the file type and size will appear. Click the section to review only that file type in comparison with the other classifications.
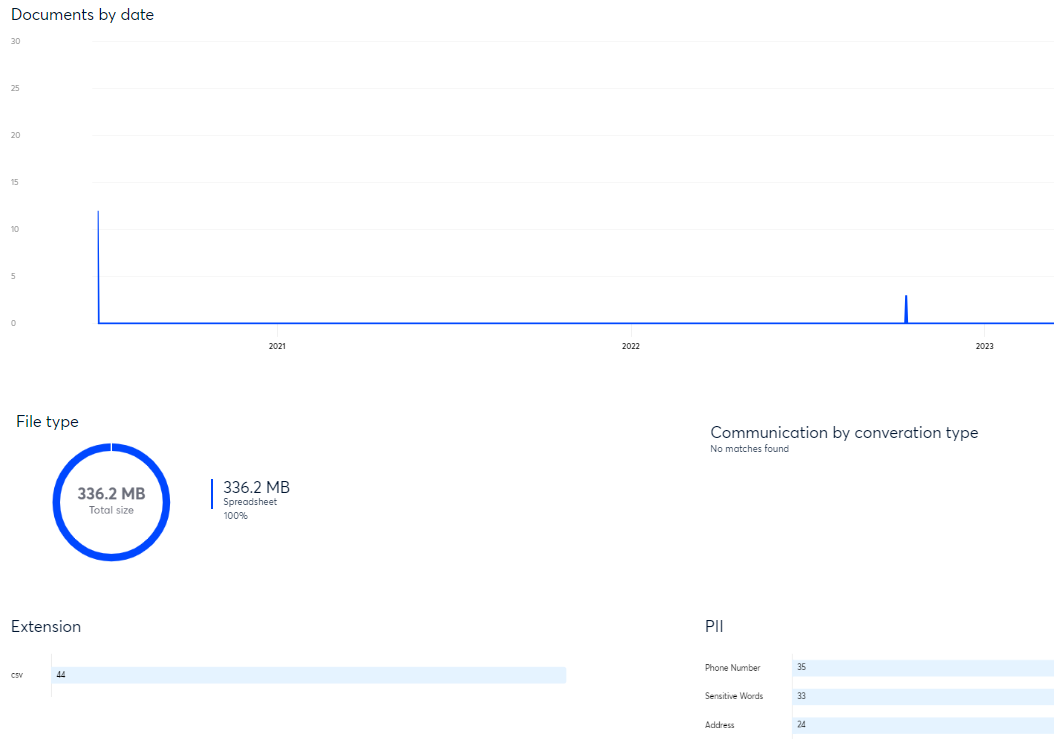
Clicking on the summary located to the right of the chart will produce identical results, along with the percentage of files included.
Communications by Conversation Type
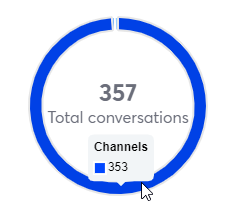
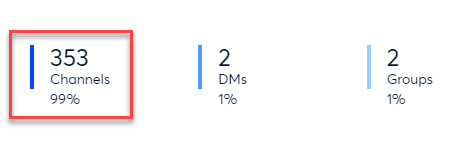
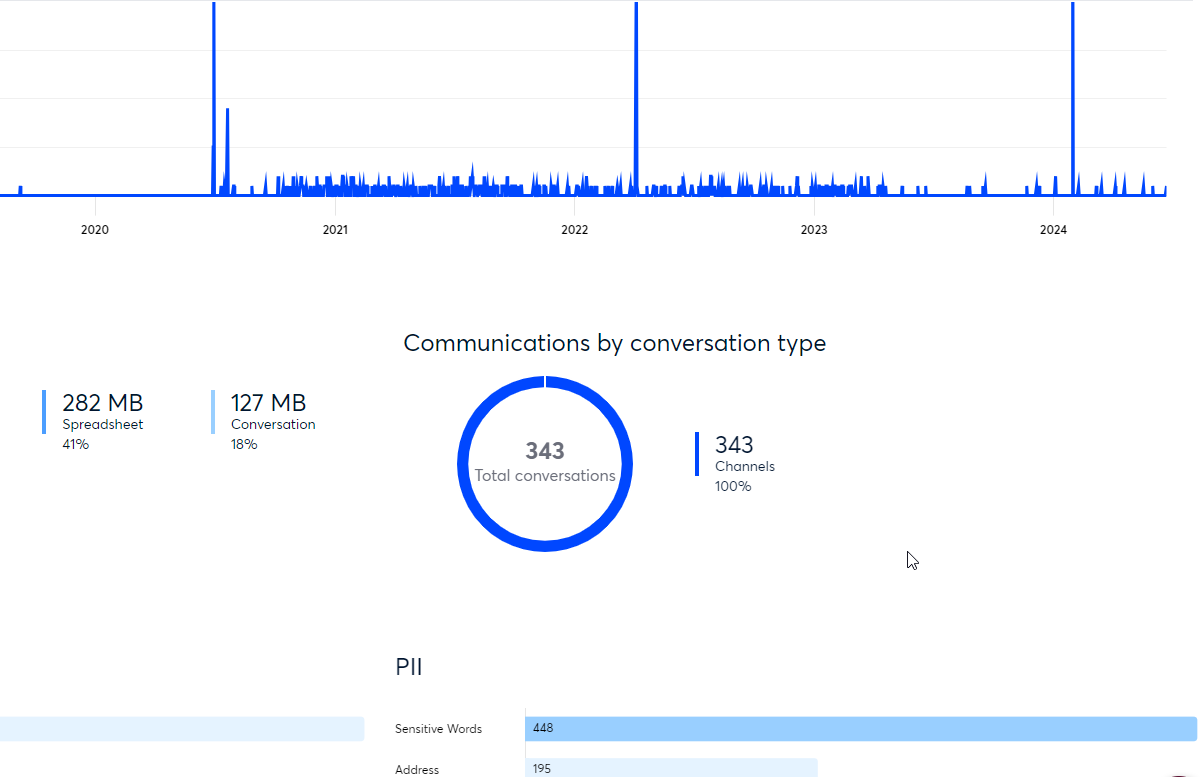
The pie chart presented here will illustrate the overall count of conversations within your data set. The types of conversations will be categorized by Channels, Direct Messages or Groups.

As you hover over each section, the conversation type and document total will appear. Click the section to review only that conversation type in comparison with the other classifications.
Clicking on the summary located to the right of the chart will produce identical results, along with the percentage of files included.
Extension
The Extension chart will show all the file types available in your data collection along with the total number included in the search.

Click the number next to the file type to review only that file type in comparison with the other classifications.
PII
The PII chart will display a list of the PII (Personally Identifiable Information) types in your data collection along with the total number included in the search.

Click the number next to the PII type to review only that PII type in comparison with the other classifications.
NOTE:
When you are in Charts view and wish to examine the search results in greater detail, you can alter your view by clicking on the Results View icon and choosing a different option, like List view. You can switch your views and keep the same search results.
.png)


