How to Use Usage Metrics
- 26 Jun 2024
- 4 Minutes to read
- Print
- DarkLight
- PDF
How to Use Usage Metrics
- Updated on 26 Jun 2024
- 4 Minutes to read
- Print
- DarkLight
- PDF
Article summary
Did you find this summary helpful?
Thank you for your feedback

In this article you will learn about:
Usage Metrics App
My Plan Page
Platform Metrics Page
Application Metrics Page
The Usage Metrics App
The Usage Metrics App offers a way for you to gain quick insights about the usage of the Onna platform through a set of dashboards that contain metrics for sites you’re a member of. The dashboards give you a clear picture of how much data is used by your organization or by your clients, if you manage their sites.
Usage metrics are specific to the site you’re signed into. If you’re a member of several sites and want to see the usage metrics of another site, open the Usage metrics app after signing in to that site. |
Viewing My Plan
The metrics available on the ‘My plan’ page offers Onna admins a way to quickly check the storage used and capacity available, of their contracted amount, in a self-serve manner. In addition to total current storage, you are also able to view the total number of unique connectors and the number of admins associated with your site.
Please keep the following points in mind related to the ‘My plan’ page:
This page is only visible to users with an Admin role in your site.
This page is not visible for any children sites you have created if you’re using the Site Manager Application.
This page is only available to Onna Cloud customers. If you don't see the My Plan page, please check with your Customer Success representative for more information about your data capacity.
To view your plan metrics follow the steps below:
Step 1:
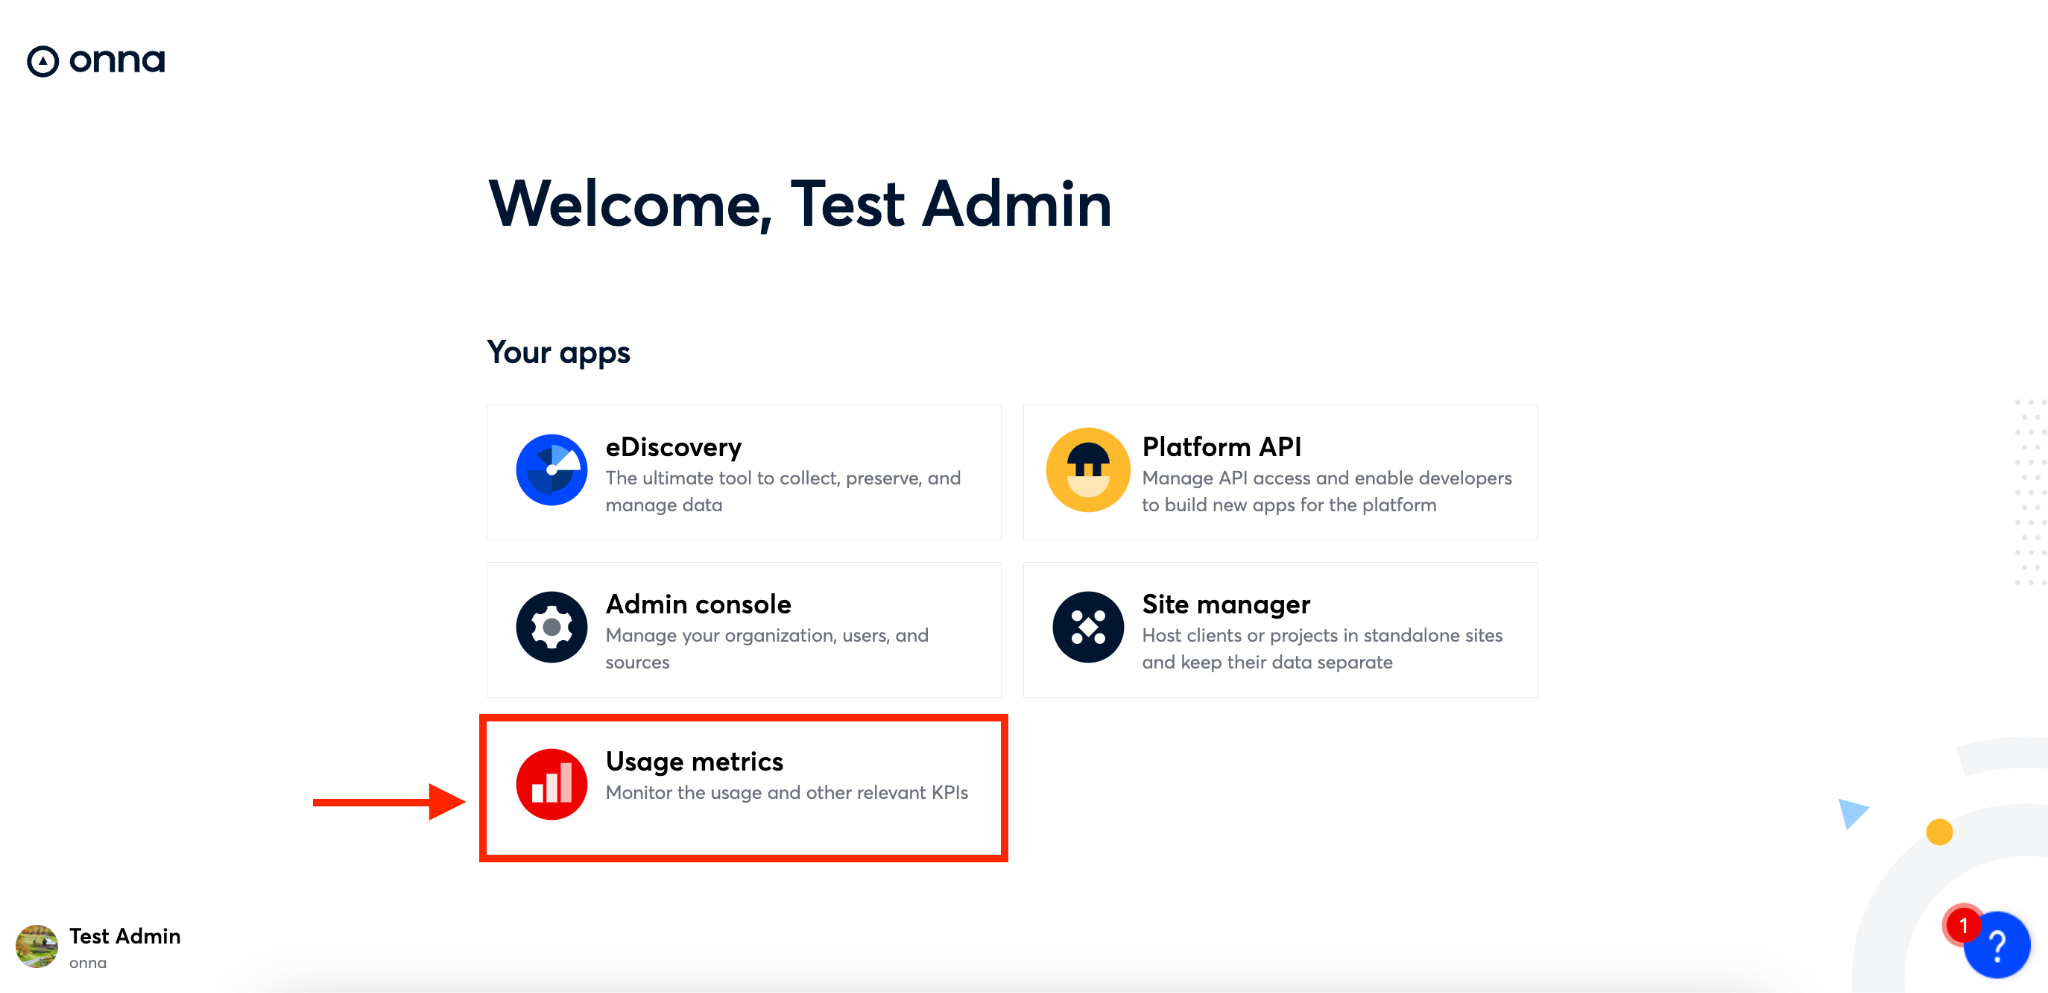
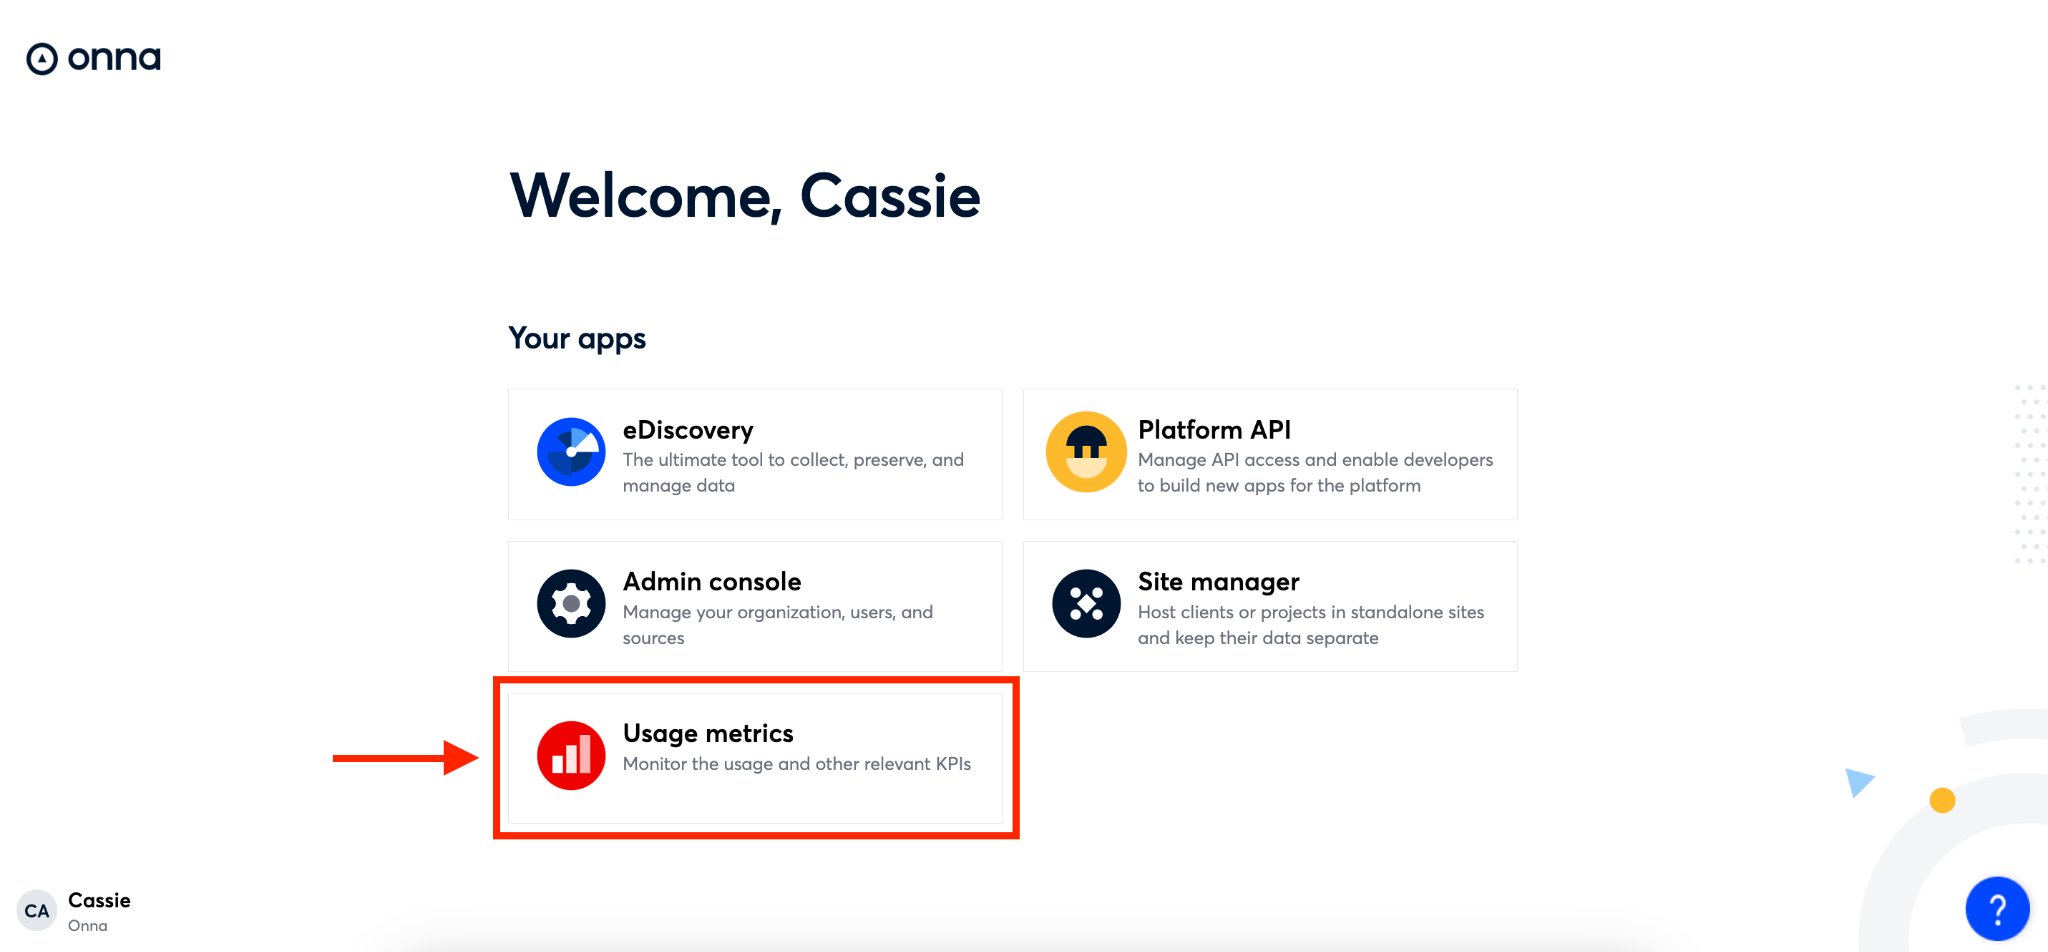
After logging into Onna, select the ‘Usage metrics’ app from your landing page.
Step 2:
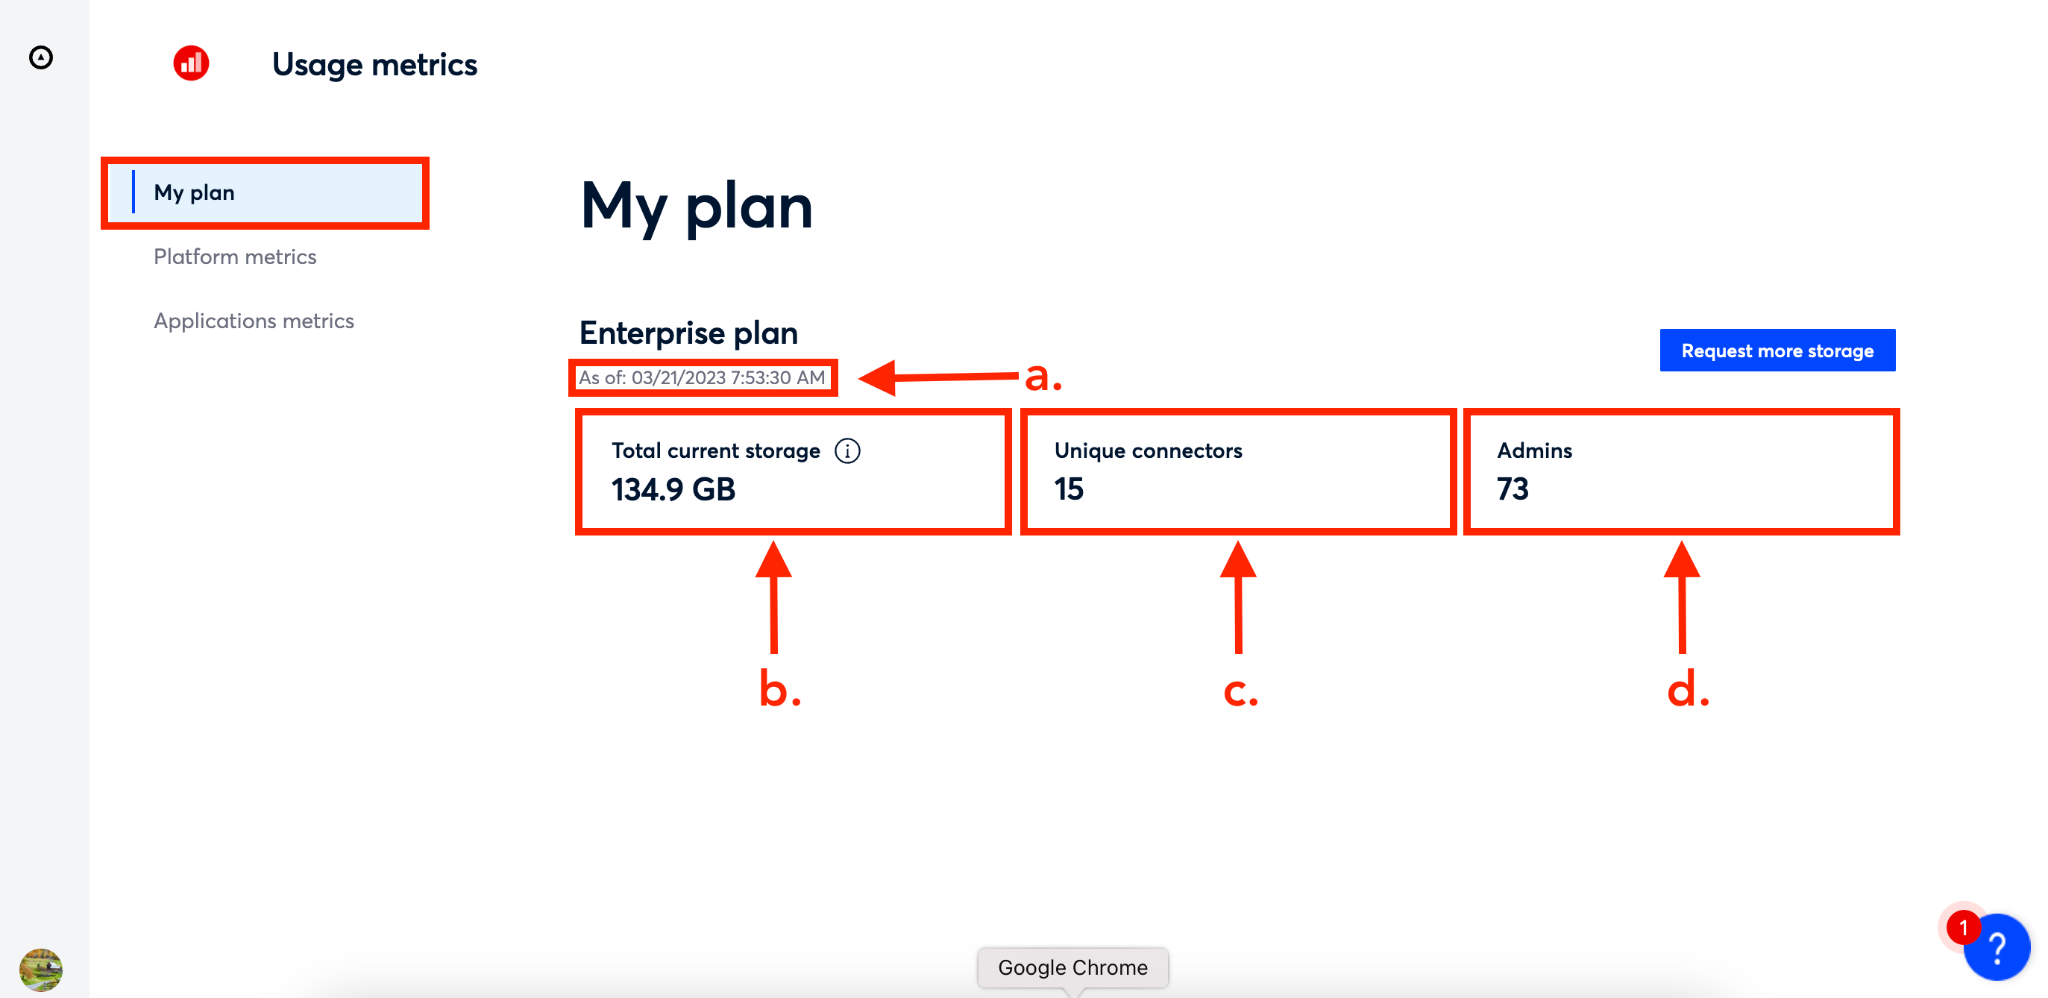
By default you will land on the ‘My plan’ page. On this page you will be able to see:
The date and time of the data is accurate as of. Note: This is updated once per day.
The total current storage you’ve used. When you click on the ‘i’ information icon in this box you will see what percentage of your total contracted amount your total current storage represents.
The total number of unique connectors associated with your site.
The total number of admins for your site.
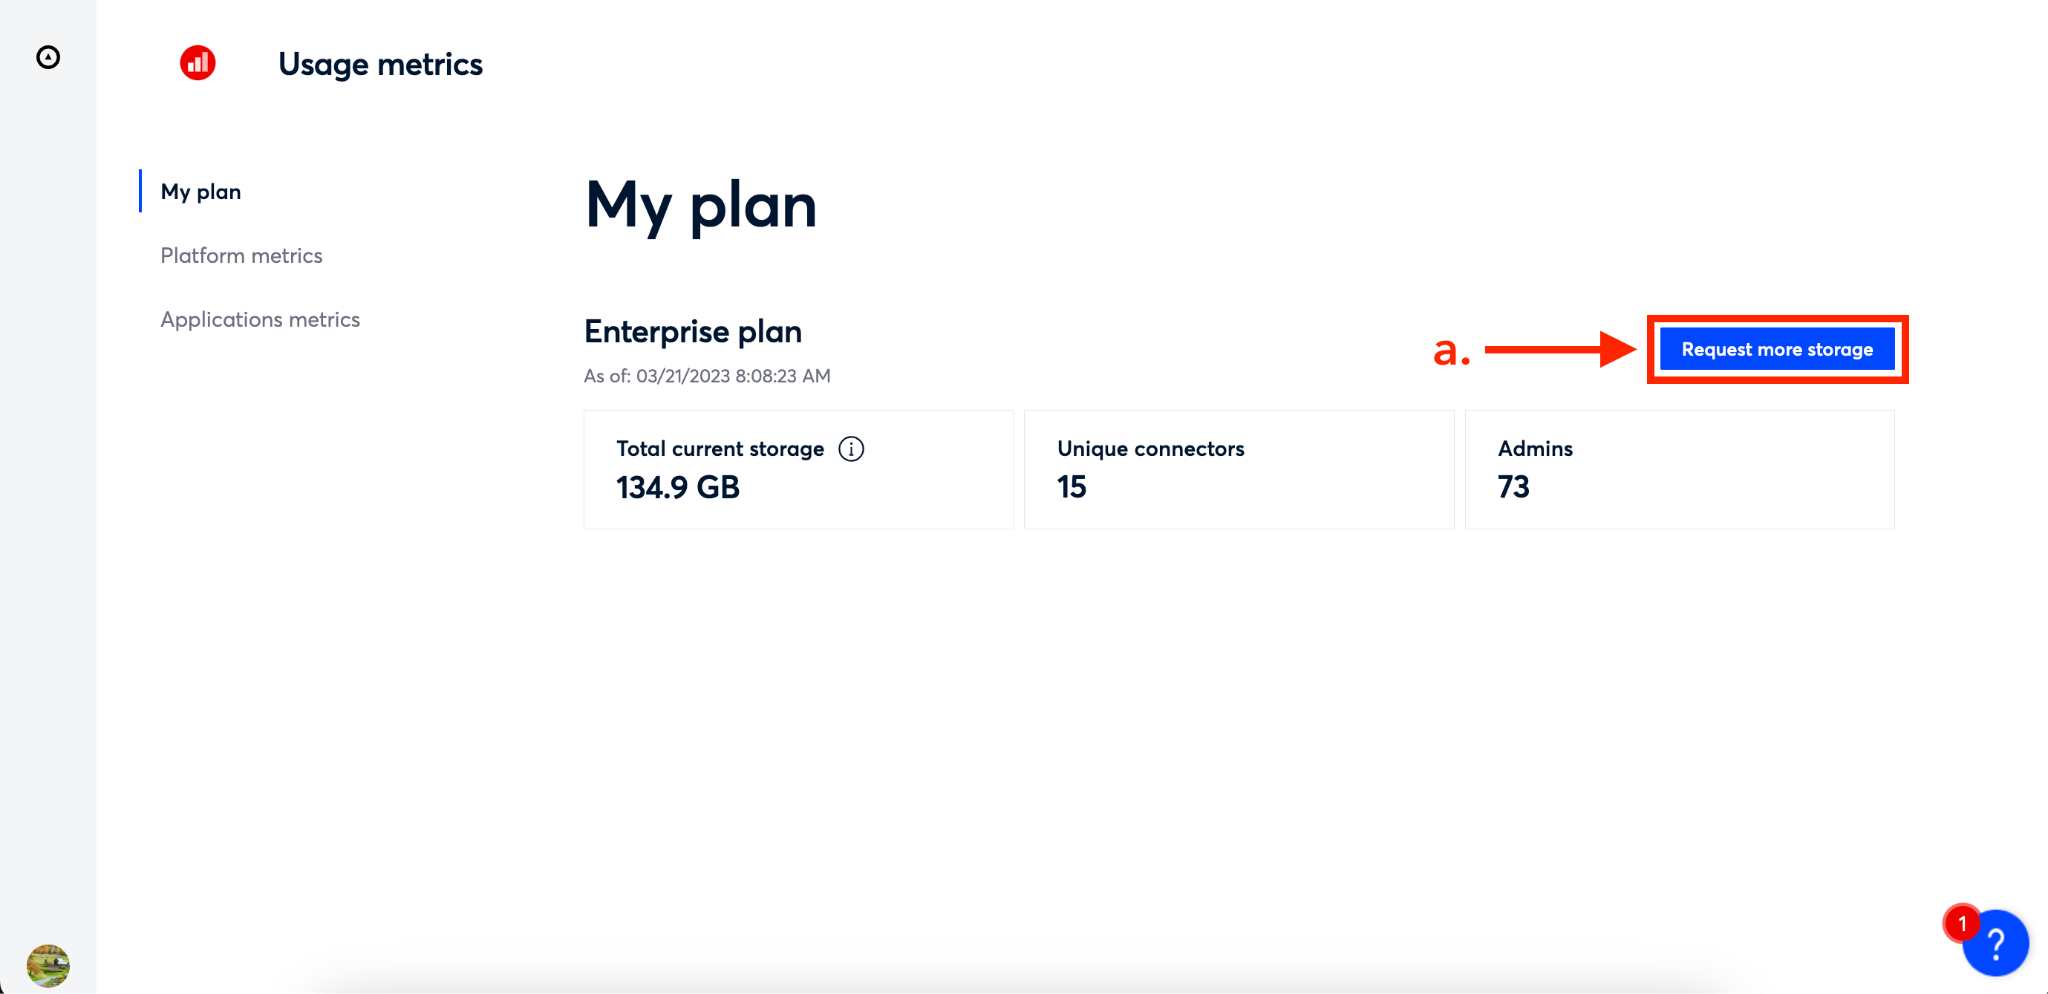
Step 3:
If you find, after reviewing your site data, that you would like more storage for your plan, simply click on the blue ‘Request more storage’ button in the upper right corner of the screen.
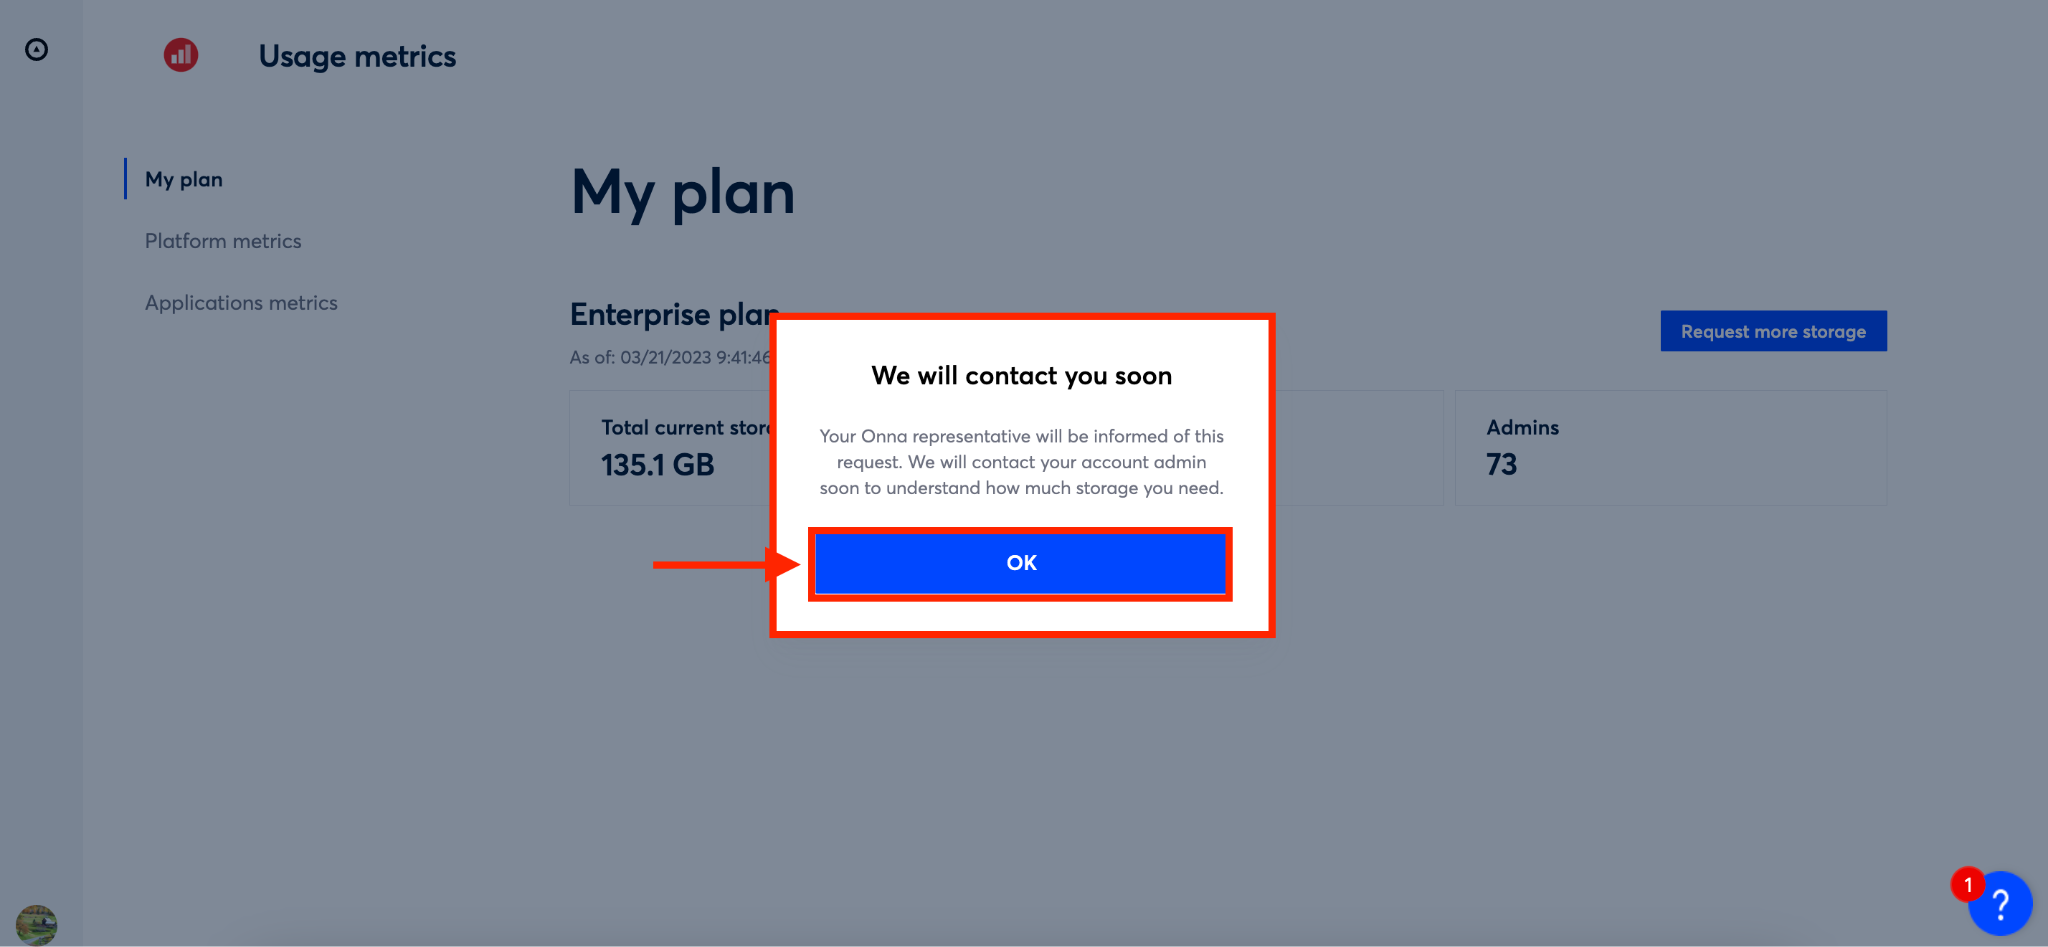
Step 4:
You will now see a confirmation pop-up appear indicating that an Onna representative will contact you soon regarding your request. From here, click the blue ‘OK’ button and your request is submitted.
My Plan Notifications
When your data is getting close to, or is at, your contracted amount you will see a notification appear on your ‘My plan’ page. Below are descriptions of these notifications.
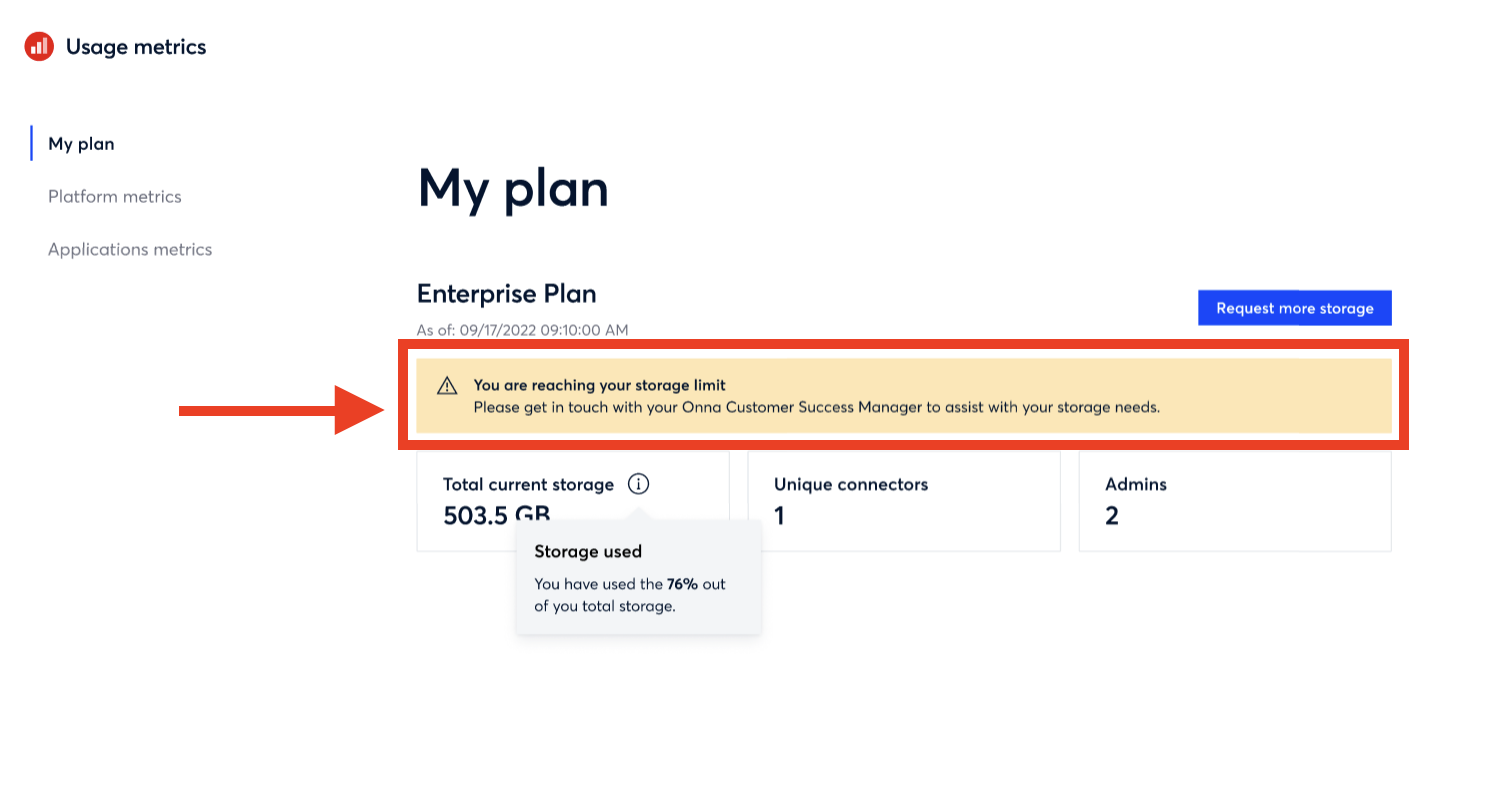
Reaching Storage Limit Notification
This notification will appear when you’ve reached 75% or more of your total contracted capacity.
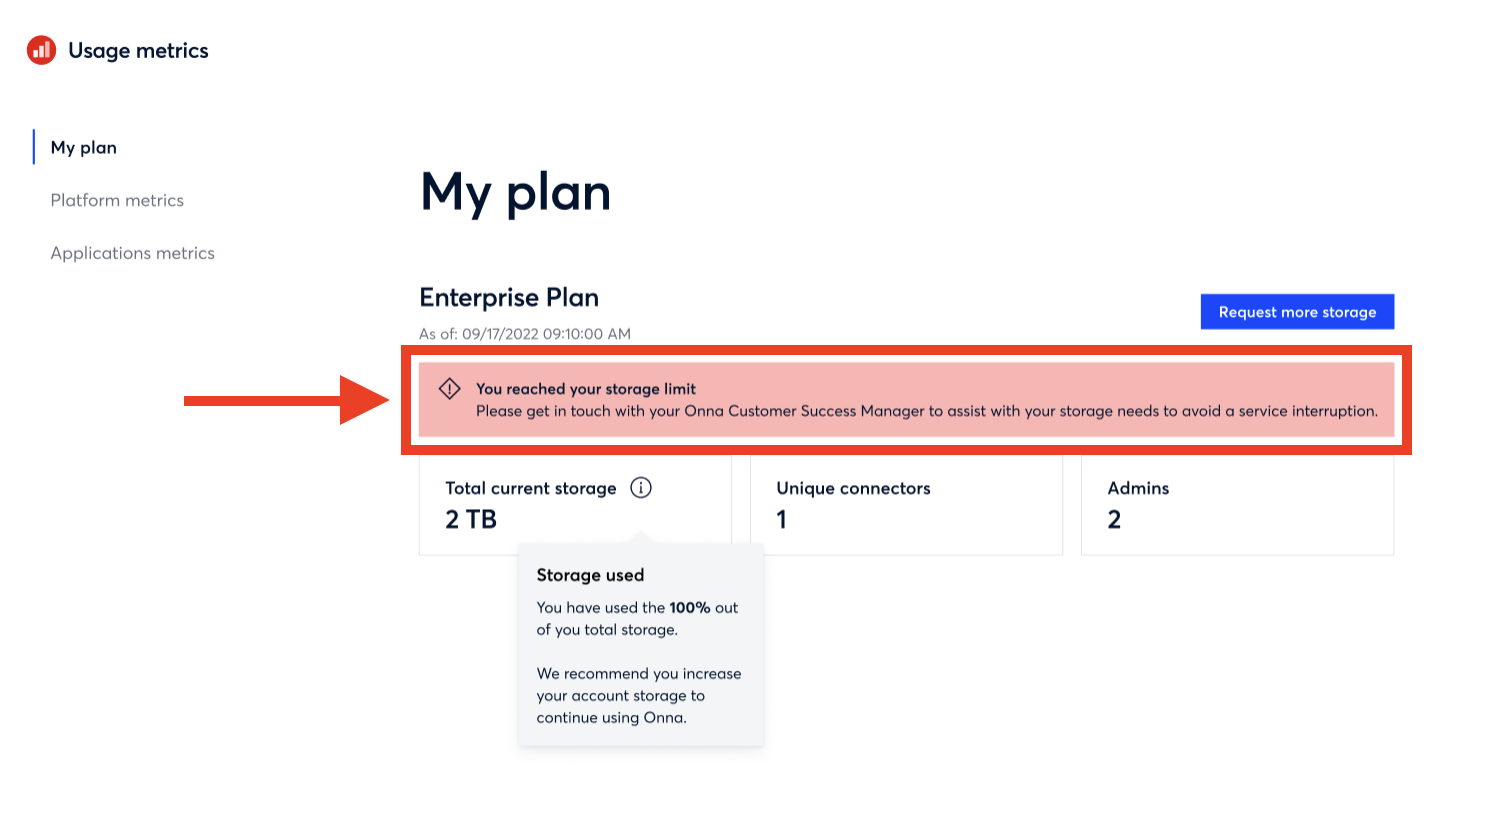
Reached Storage Limit Notification
This notification will appear when you’ve reached 100% of your total contracted capacity. It is important to contact your Customer Success representative at this point to ensure you don’t experience a service interruption.
Viewing Platform Metrics
The metrics in the Platform metrics page refer to the current status of your data unless it’s stated differently. To view your platform metrics follow the steps below:
Step 1:
After logging into Onna, select the ‘Usage metrics’ app from your landing page.

Step 2:
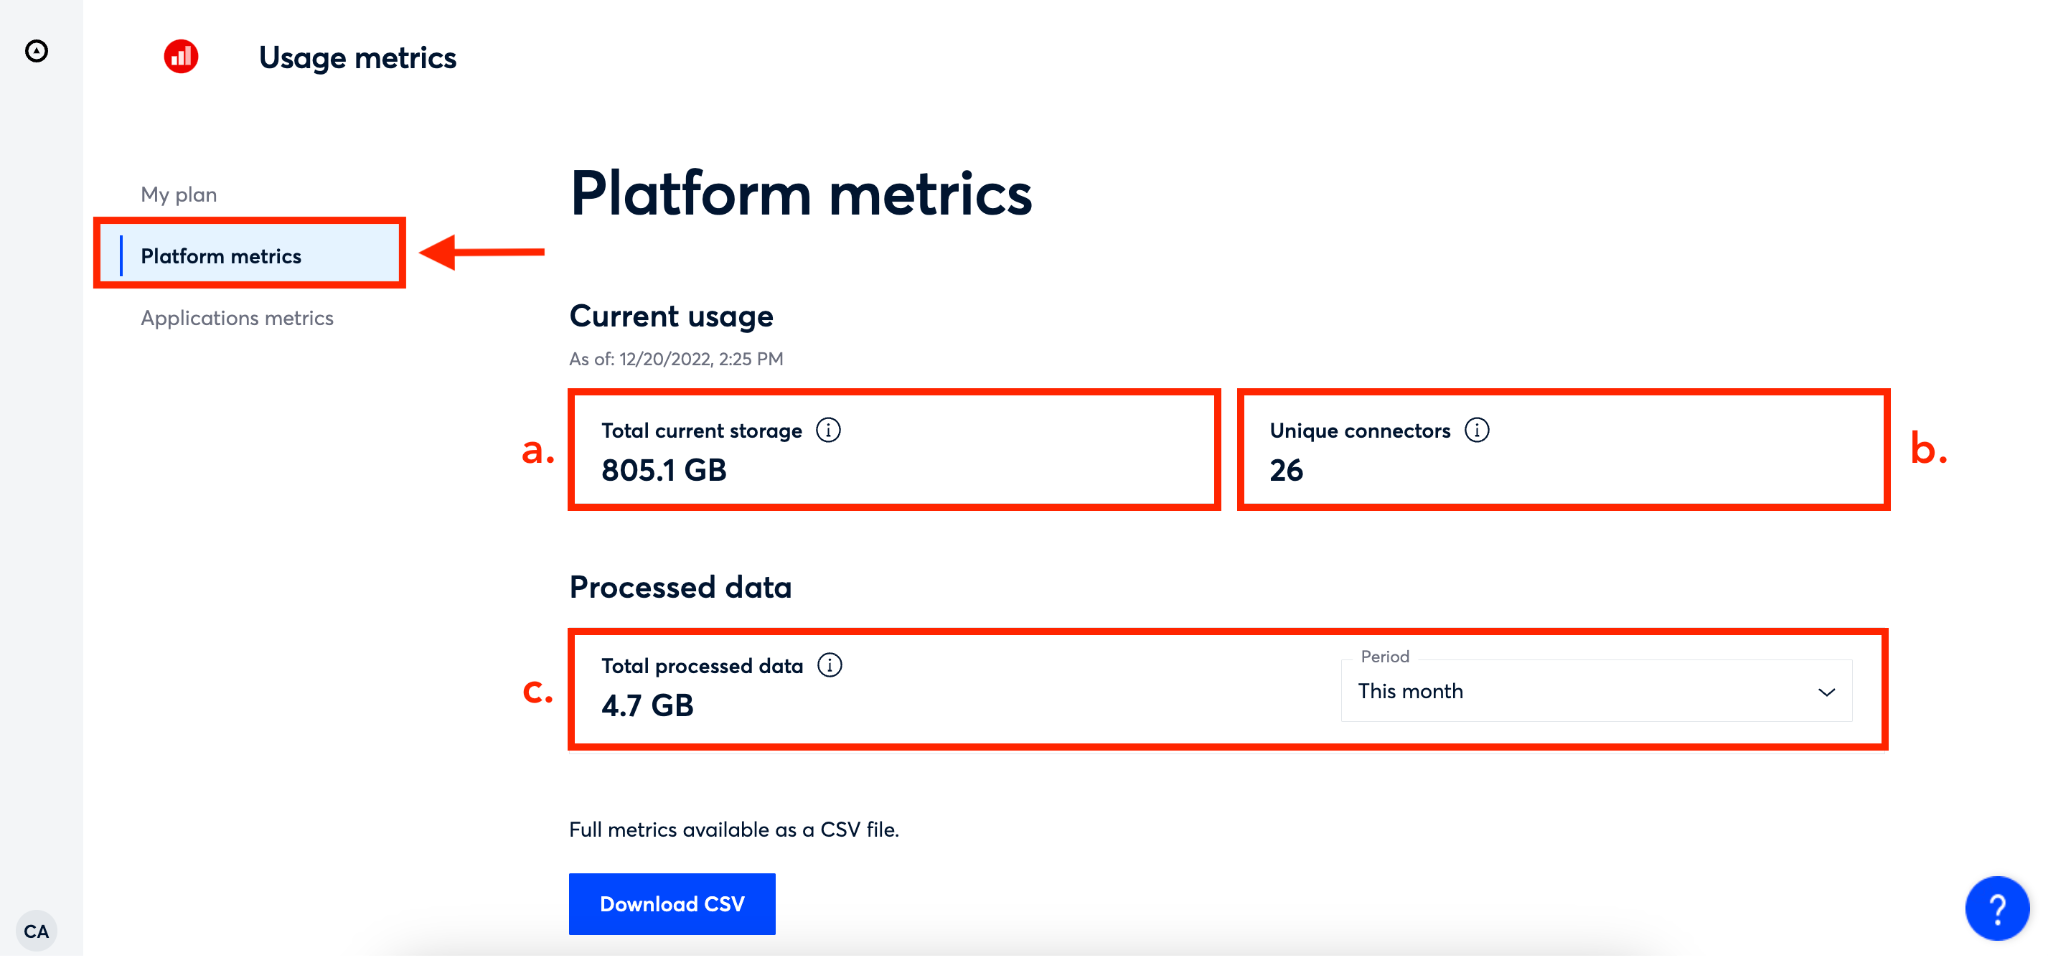
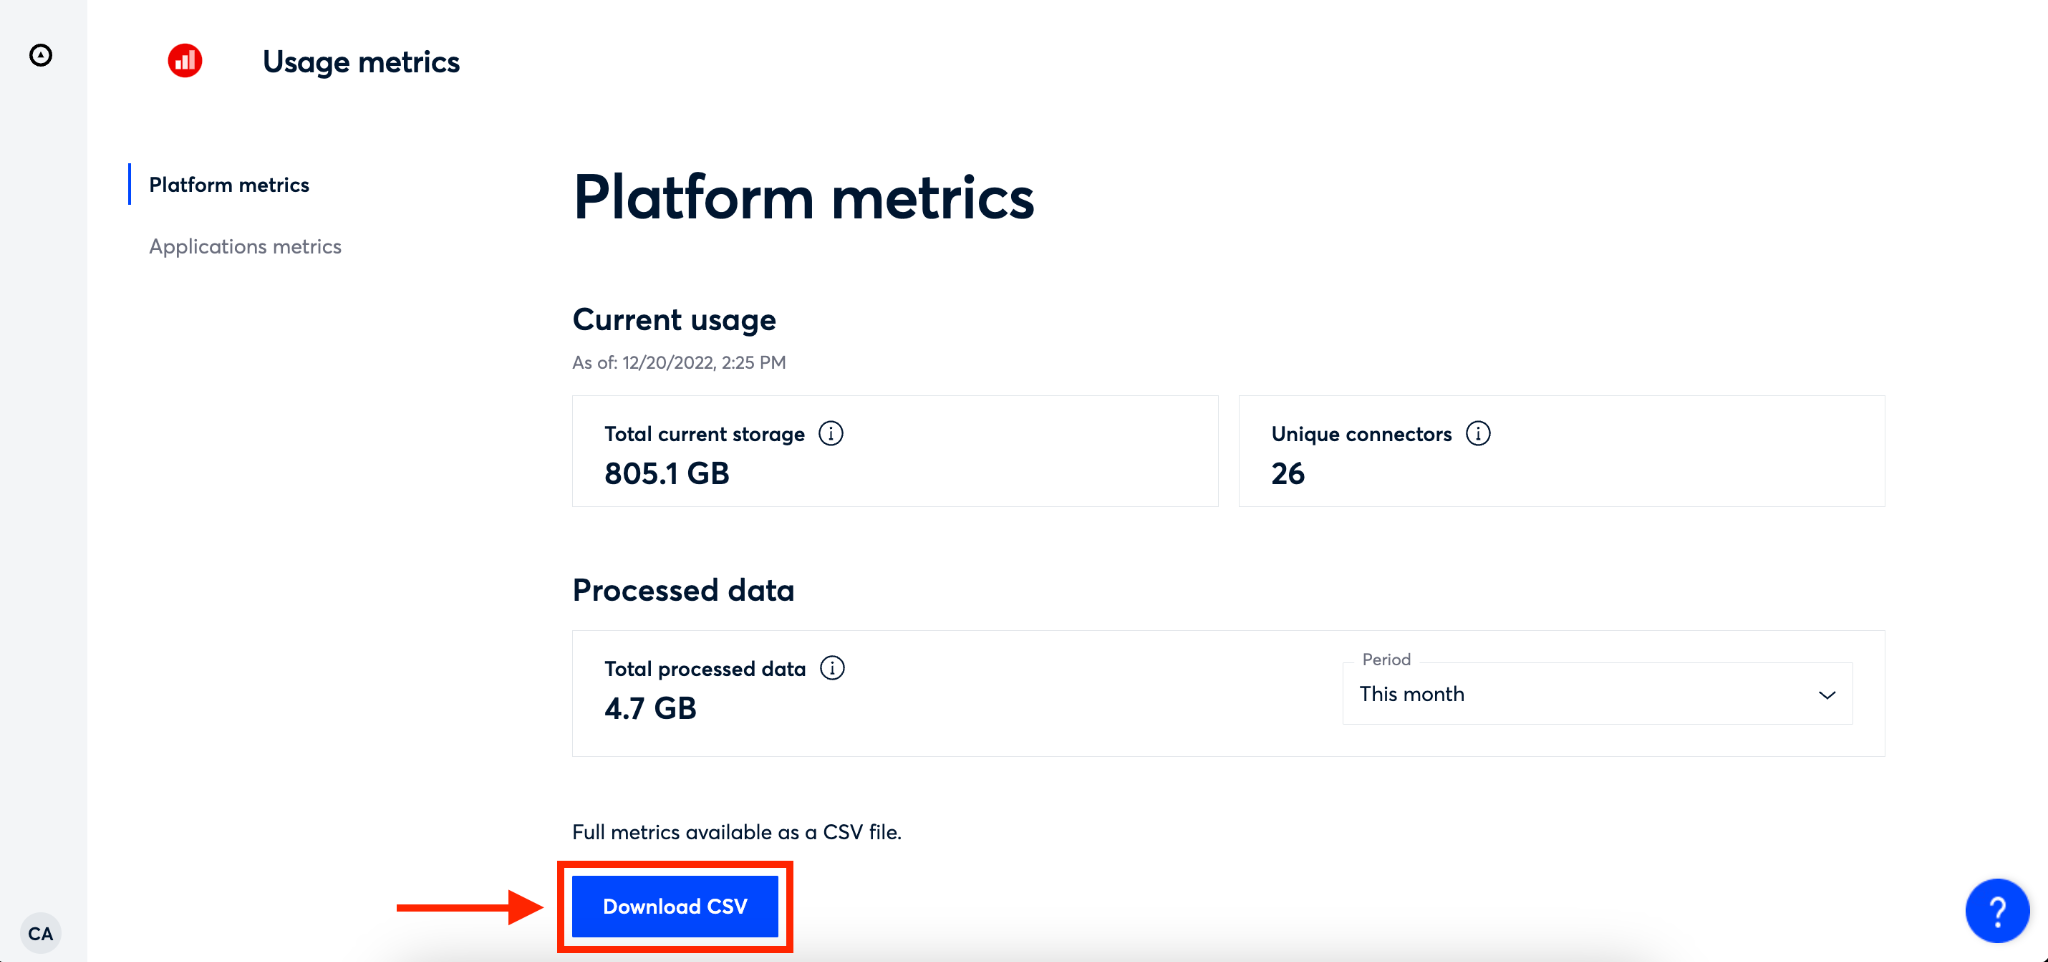
By default you will land on the ‘My plan’ page. To view your Platform metrics, click on the platform metrics tab on the left side of your screen. Once on the ‘Platform metrics’ page you will be able to see:
Your total current usage
The number of unique connectors being used in your site.
The total amount of data processed for a given time period. To adjust the time period, click on the arrow next to ‘This month’ and you’ll be able to select a different time period.
Step 3:
You can also download a CSV of your platform metrics by clicking the blue ‘Download CSV’ button at the bottom of the page. This allows you to visualize the metrics in your favorite analytics tool.
The platform metrics report contains the metrics available in the UI as well as additional metrics. For a full list, see the Platform metrics reference article.
Viewing Application Metrics
In addition to viewing usage metrics for the entire platform, you can also view metrics specific to applications. To view application specific metrics follow the steps below:
Step 1:
After logging into Onna, select the ‘Usage metrics’ app from your landing page.
Step 2:
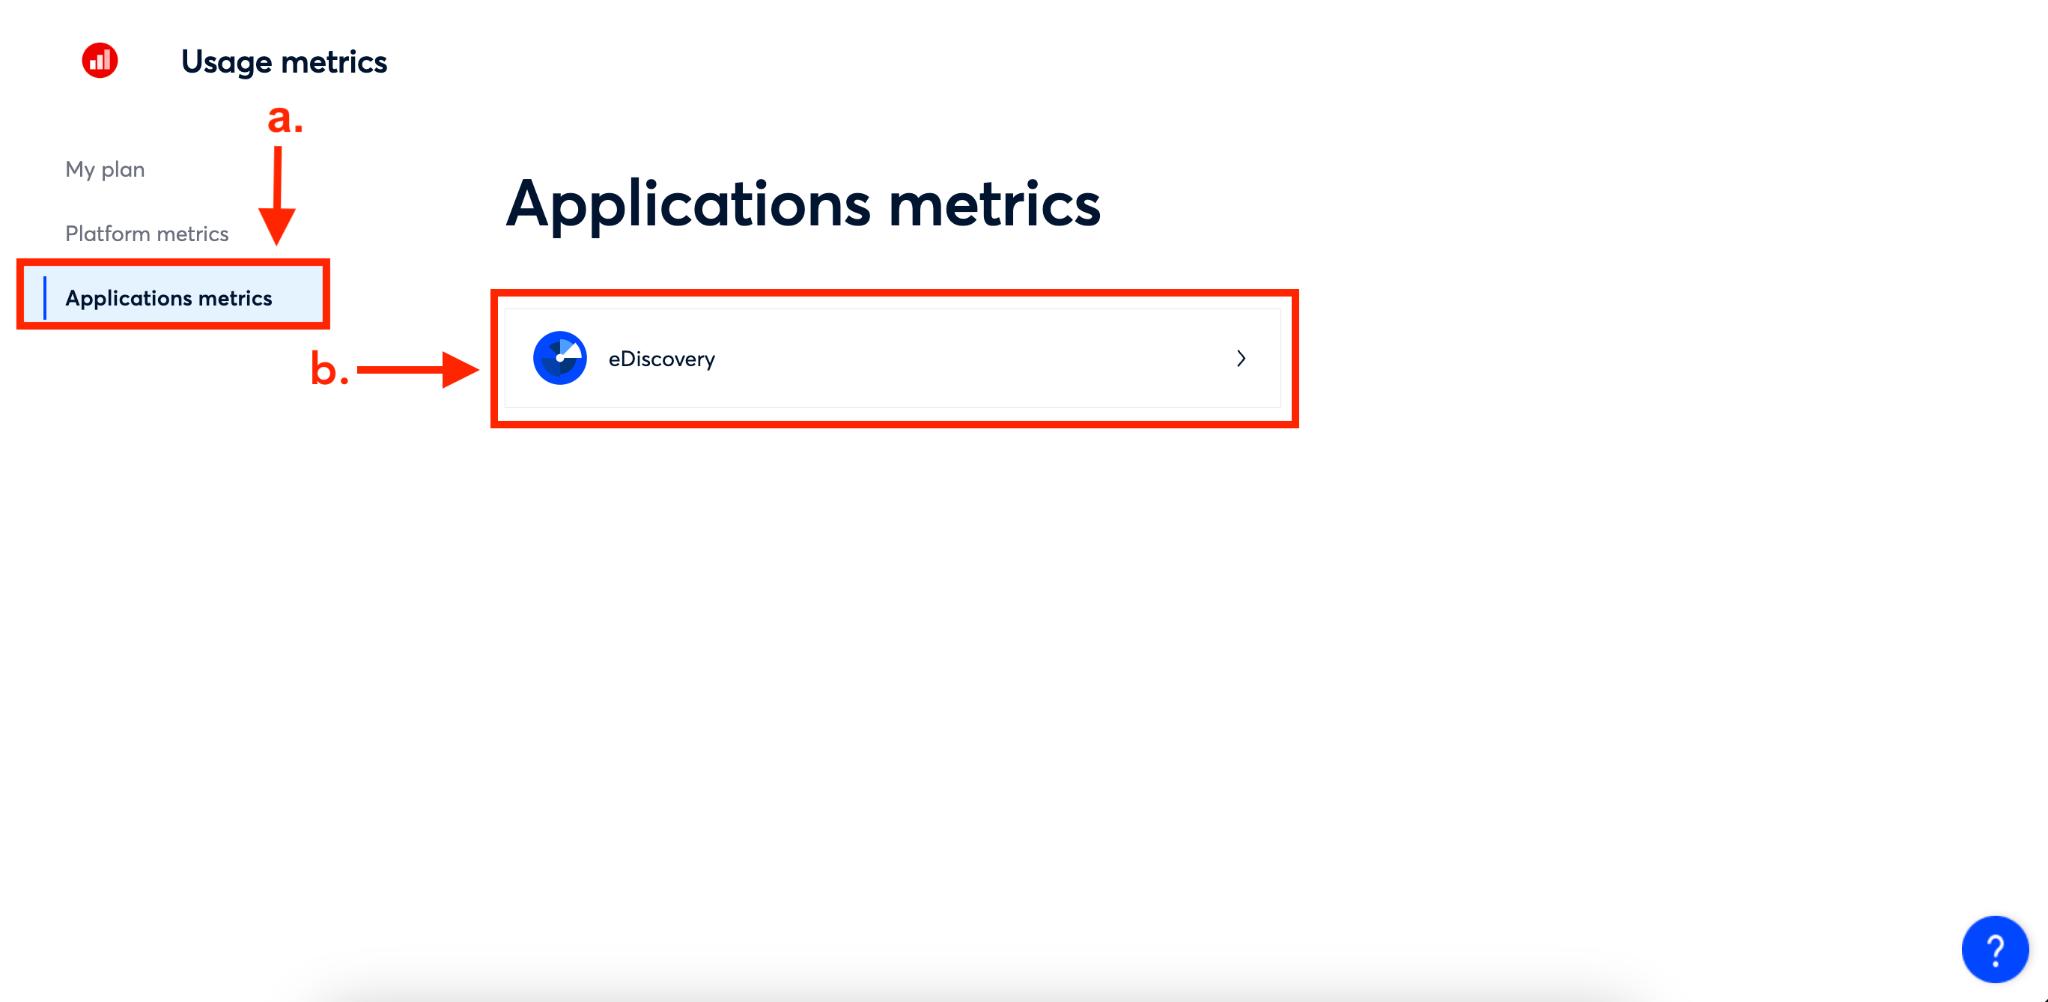
By default you will land on the ‘My plan’ page. To navigate to application metrics:
Click on ‘Application metrics from the menu on the left side of the screen.
Select the application you want to see metrics for.
Step 3:
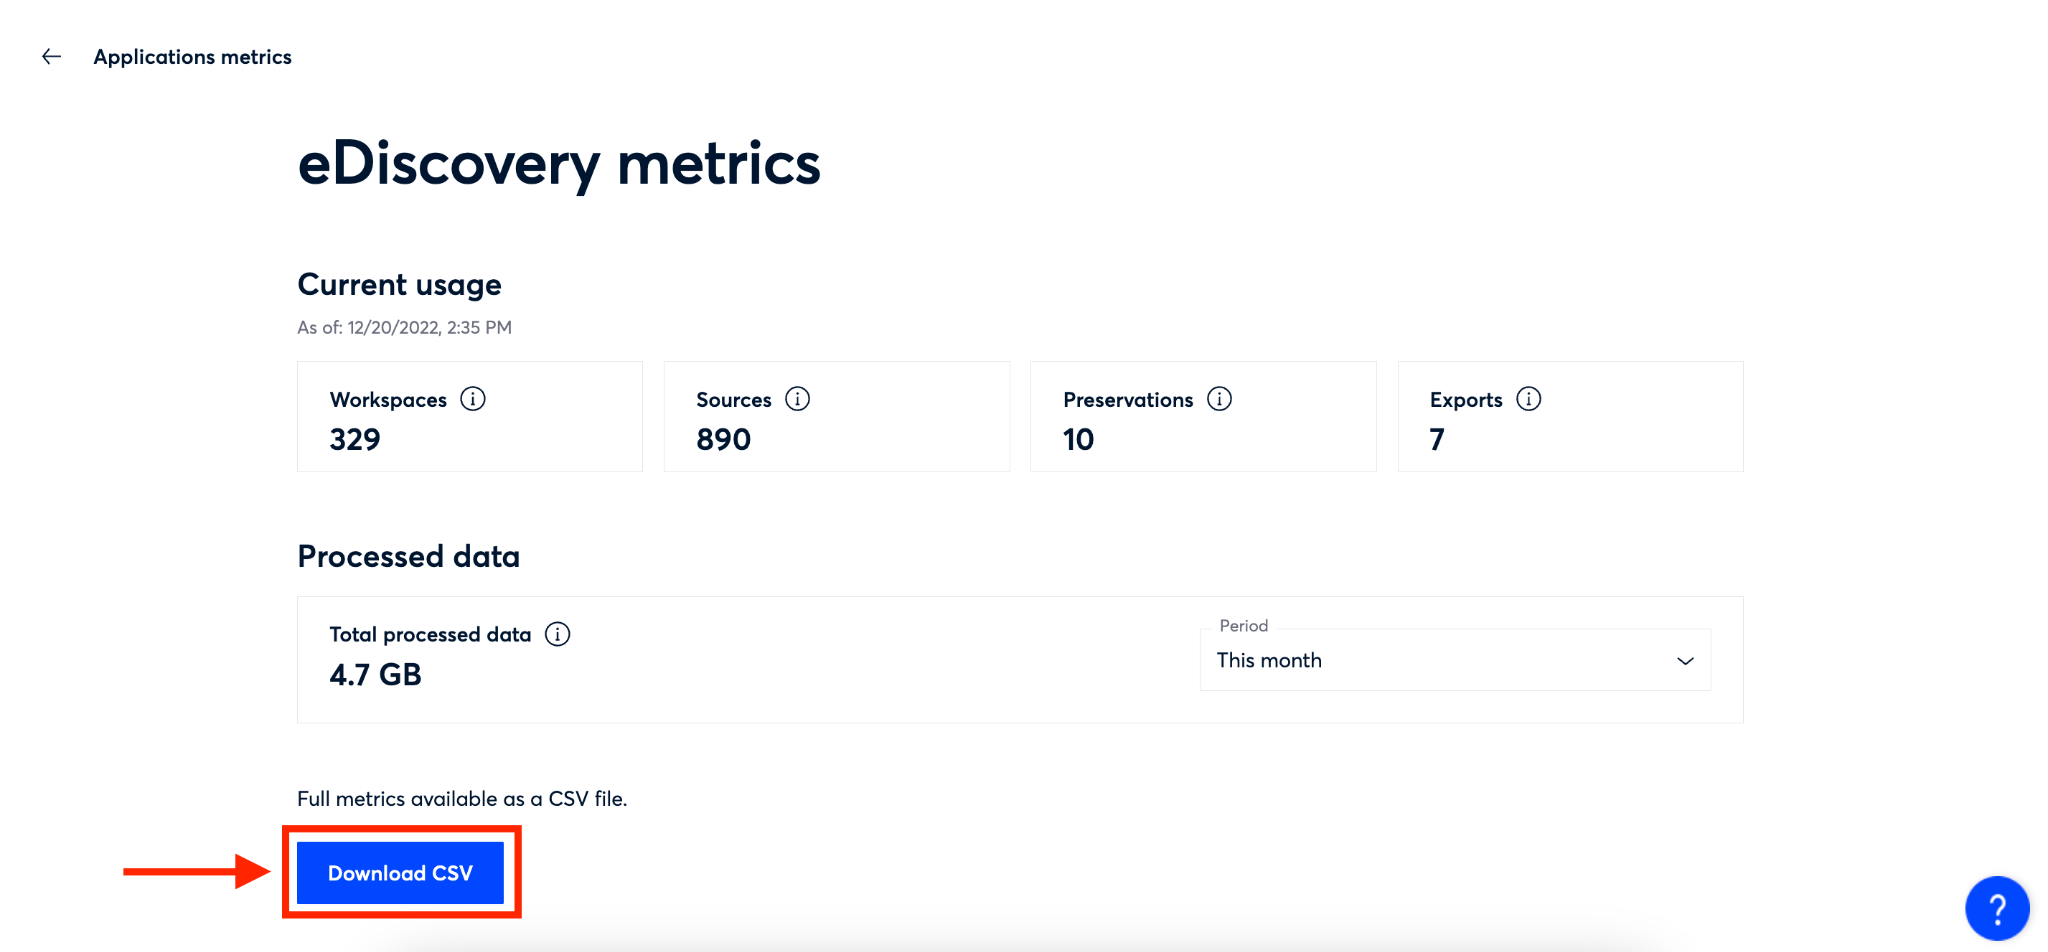
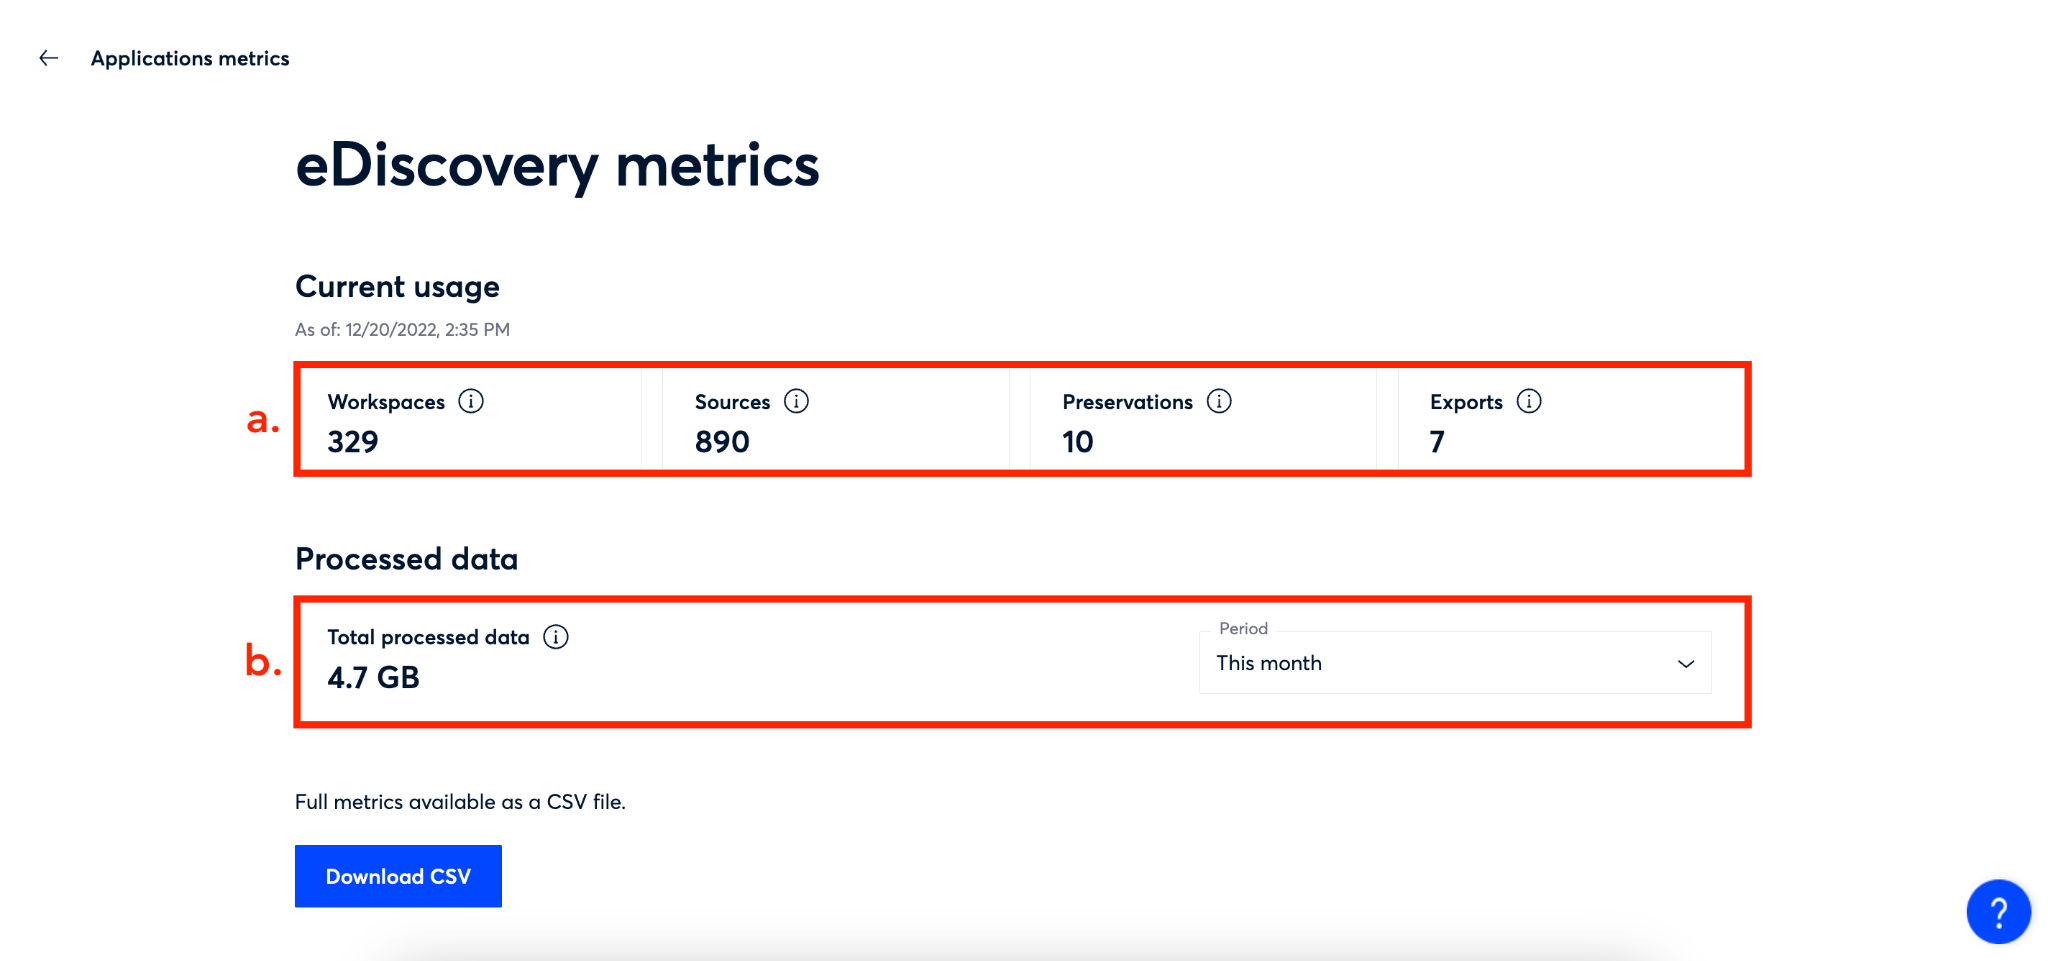
In the eDiscovery metrics page you will see:
The total number of workspaces, sources, preservations, and exports in your eDiscovery app
The total amount of data processed for a given time period within the eDiscovery app. To adjust the time period, click on the arrow next to ‘This month’ and you’ll be able to select a different time period.
Step 4:
You can also download a CSV of your eDiscovery metrics by clicking the blue ‘Download CSV’ button at the bottom of the page. This allows you to visualize the metrics in your favorite analytics tool.
The eDiscovery metrics report contains the metrics available in the UI as well as additional metrics. For a full list, see the eDiscovery metrics reference article.