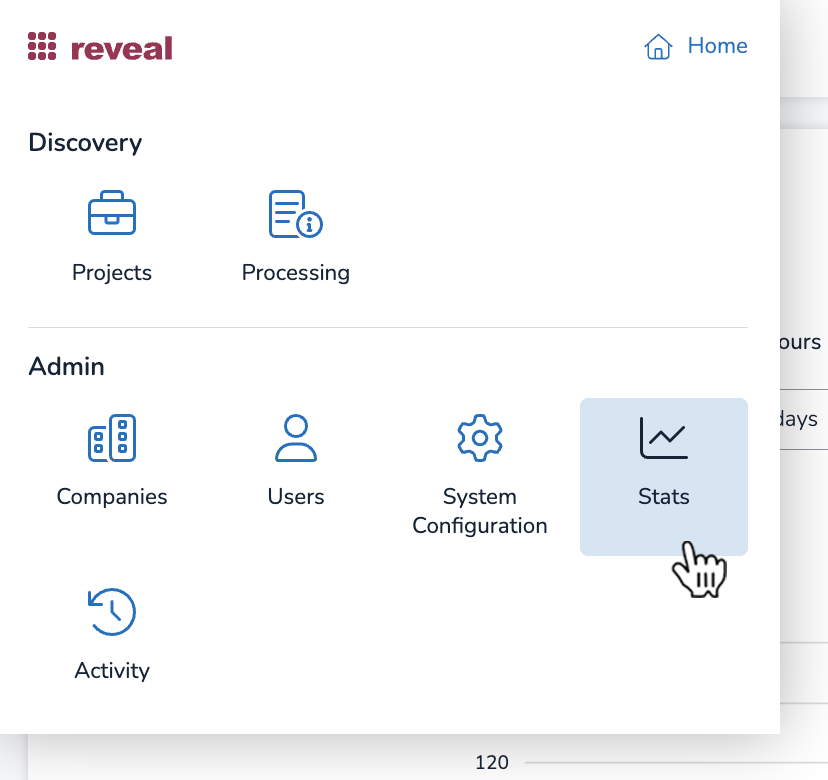
The Instance Stats screen provides Instance Admins with a single area to monitor various data reports across all companies and projects. It can be accessed from the home menu button in the upper left corner of Reveal’s interface.
Important
Due to contractual differences, statistics may be delayed by 24–48 hours and differ from final invoices.
Opening this screen will present a graph of data that can be modified by data type, time frame, and by project and/or company via dropdown menus above the graph. Data is presented cumulatively, which means each data point is the total amount of data usage at that point.
.png)
Click the first dropdown to switch your data usage between Image Labeling, Transcription, Translation, and GenAI Review job data usage.
Click the second dropdown to choose a time frame – 30, 60, or 90 days.
Click the third dropdown to see data by the day, week, or month.
Click the fourth dropdown to choose which companies and projects are represented in the graph. A blue “All Projects Selected” pill is present by default; the graph will show usage data across all projects and companies.
Deselecting All Projects will reset this dropdown to zero.
Select individual projects to add data to your graph.
Select individual companies to add data from all of its associated projects to your graph.
The blue pill will update to show number of projects present in your graph.
.png)
At any time, press the Download button to download your graph as a CSV file.
Note
For information on how to calculate your monthly consumption rates, please see Calculate Monthly Consumption Rate – AI Data Enrichment.