The Processing screen off the Navigation Panel provides details about successfully processed project data via a variety of pages.
Similar snapshot information is available in the Environment module of the Discovery Manager desktop application. For more details, refer to the article Post-Import Snapshot and Controls.
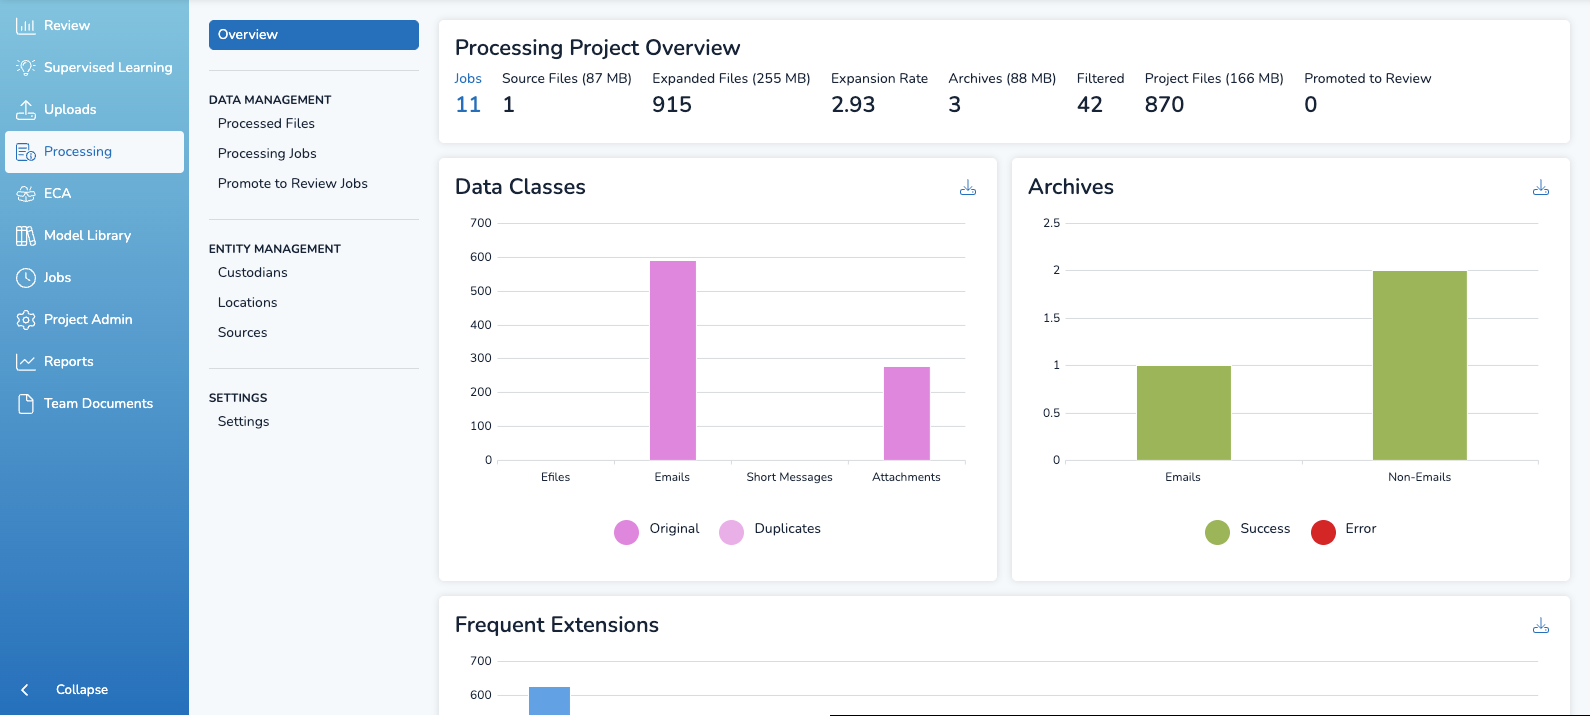
The Overview page has a variety of statistics and visuals about your processing projects. It’s the default page when opening the Processing screen.
Jobs: Number of processing import jobs successfully completed.
Source Files: This provides a one-to-one match of the uncompressed data imported into the project.
Expanded Files: Total number of files (source files and archive children) after processing prior to any data filtering.
Expansion Rate: Growth of the data size from the source to expanded files. The larger the number, the more data that was expanded from the unprocessed source data.
Archives: Total number of archive files within the project
Filtered: Total number of files filtered out of the project due to project level filters.
Project Files: Total number of files contained within the project after processing and filtering.
Promoted to Review: The total number of documents for processing jobs set up for review promotion. Details about these jobs can be found under Data Management > Promote to Review Jobs.
Graphs
Three graphs are available in the Overview page.
Data Classes: A breakdown of original and duplicate efiles, emails, and attachments.
Archives: Total number of archive files within a processing project.
Frequent Extensions: File extension type by frequency.
Data can be exported as an Excel (.XLSX) file by clicking the ![]() Download icon in the upper-right hand corner of any graph.
Download icon in the upper-right hand corner of any graph.
Feature Flag
All of the below features are under feature flag. They will not appear in your environment unless they’re manually enabled by Reveal. Contact your Customer Success Manager if you’d like to learn more or request access.
Processed Files
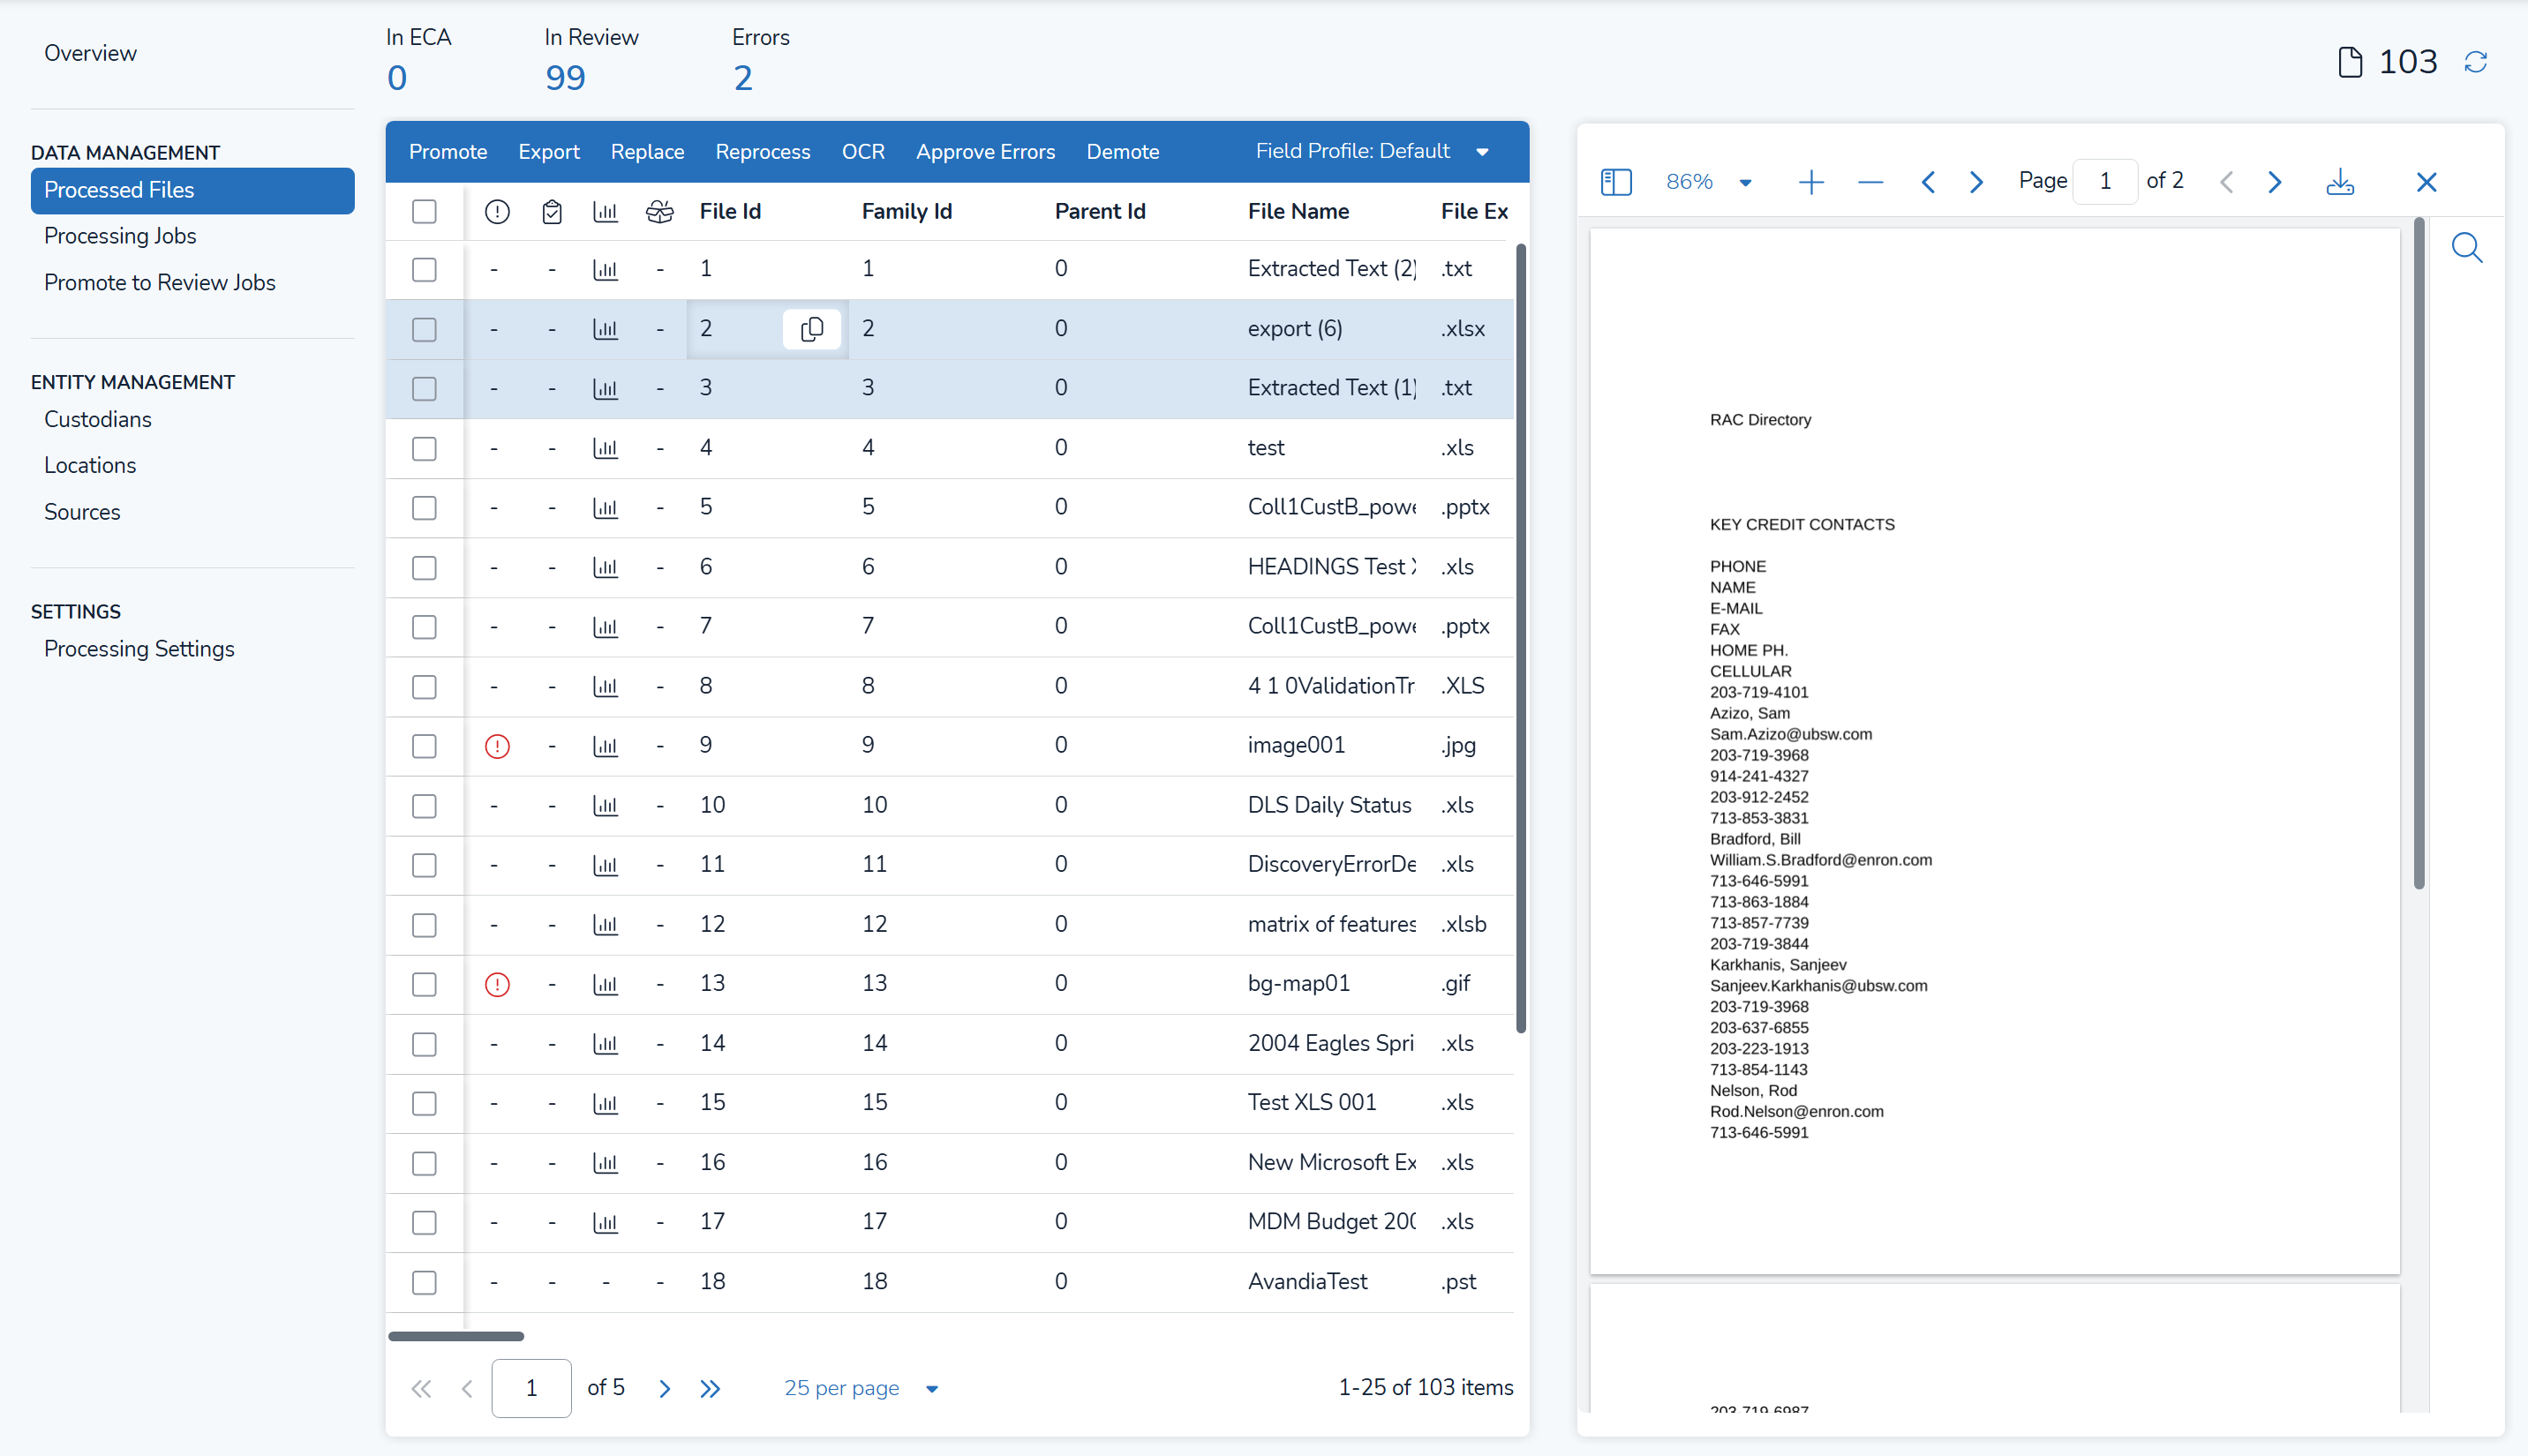
The Processed Files page provides a list of all the documents that have been processed, displayed through the Processing Grid.
By clicking anywhere in a row other than the View button, the preview screen will display the selected document side by side with the grid.
Note
This Document View will only display a text view.
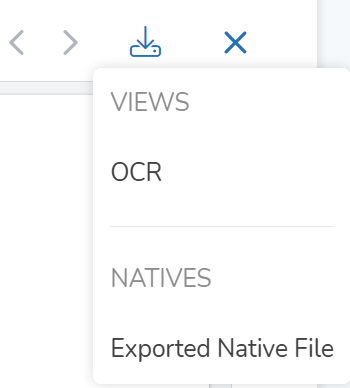
In the Document View, users can navigate to the Download button and quickly download Views or Natives of the document.
 .
.
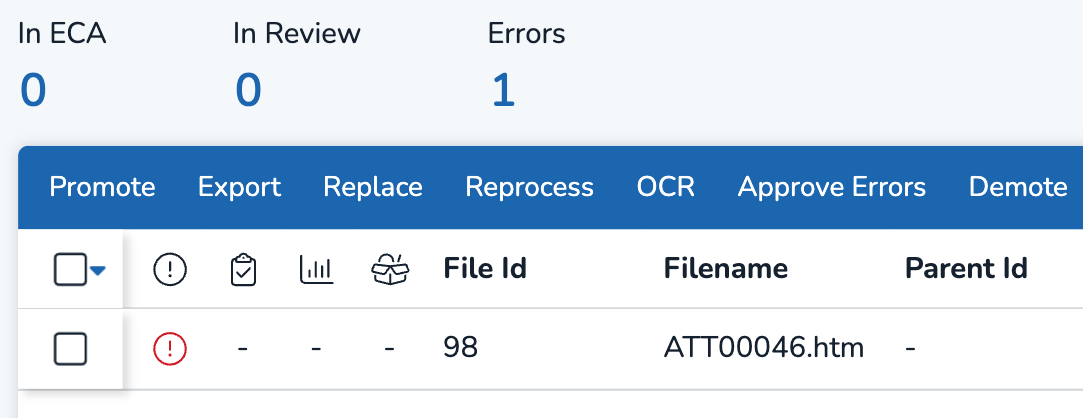
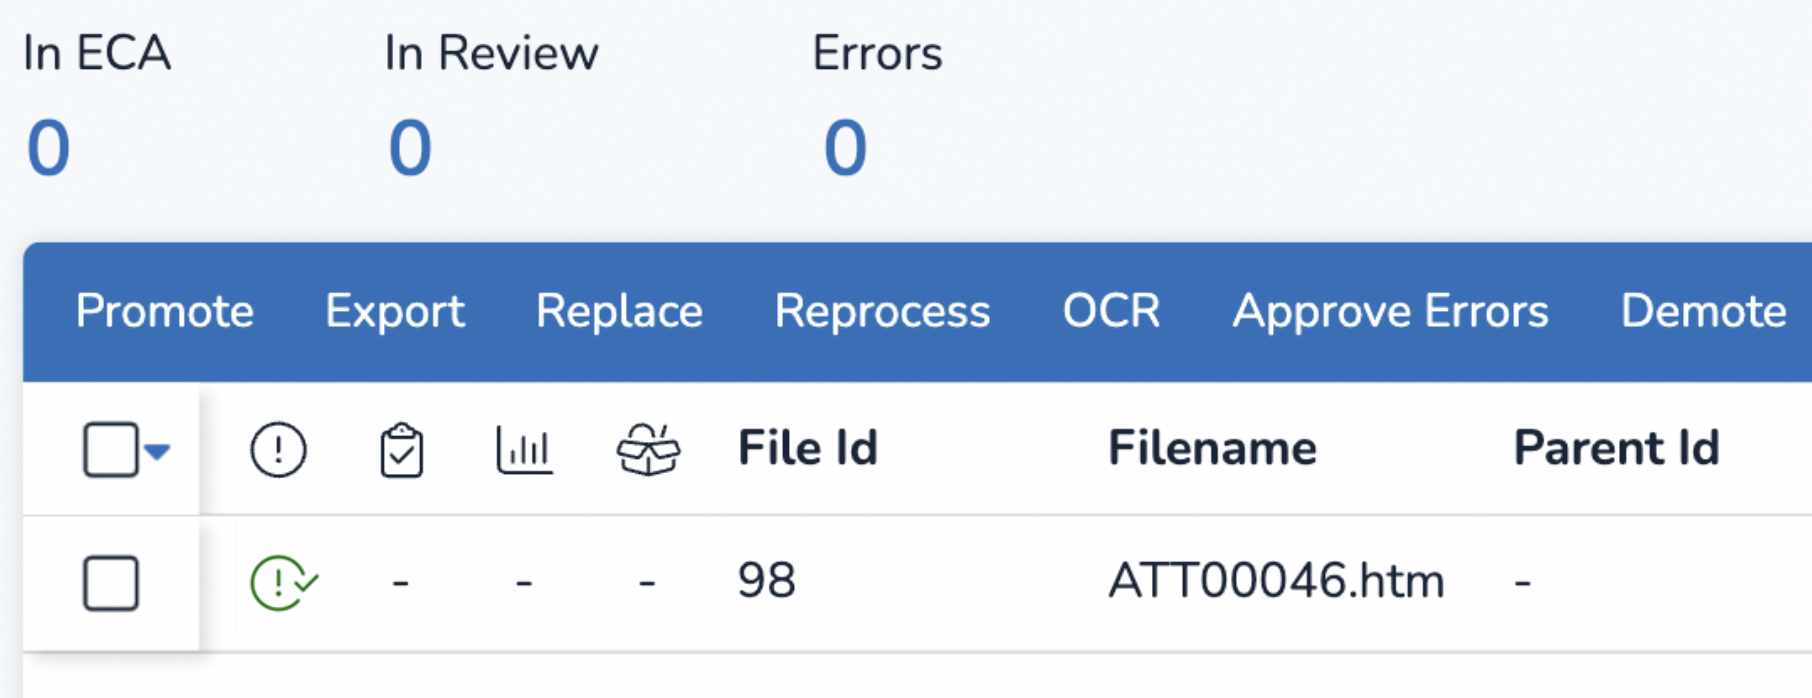
Above the Processing Grid, numbers display for the amount of documents in ECA, in Review, and documents with processing errors. You can quick filter your grid by touching any of these values.
Documents must be promoted to Review in order to view them in the Document Viewer.
Processing Errors
Documents that error during processing will show up on the grid with a ![]() red circle icon. Hovering over this icon will display the reason why the document errored.
red circle icon. Hovering over this icon will display the reason why the document errored.
Within the Processing Grid, you can perform one of three actions on errored documents:
A) Reprocess the document
This will re-import your errored documents.
Choose which documents you want to reprocess from the Processing Grid. Either select individual documents using the check boxes, or perform a search to cull your data.
In the Processing Grid Toolbar, click Reprocess.
The Reprocessing Job Modal should appear.
In the Act On tab…
“Select Documents” will be chosen by default. Click All Documents in Results List to instead reprocess all filtered documents that currently show in the Processing Grid.
Under the Settings tab…
Name your Reprocessing job.
Fill in the password bank, separating each file password with a comma. Passwords do not need to be on separate lines.
Decide whether to enable PST scan.
Decide whether to OCR during reprocessing, whether to index errors, and if this should apply to all PDFs.
Select an OCR mode — Most Accurate, Fastest, or Balanced (mix of both)
Decide whether you want an OCR timeout.
Press SUBMIT.
A green popup box will acknowledge that your Reprocessing job has been processed. Click View Job to jump to the Jobs screen, where you can see the status of your Reprocessing jobs.
Any settings updated in the Reprocessing modal will remain in effect for all future processing jobs within your current project.
B) Replace the document
This will replace your errored documents with new identical files from another folder.
Choose which documents you want to replace from the Processing Grid. Either select individual documents using the check boxes, or perform a search to cull your data.
In the Processing Grid Toolbar, click Replace.
The Replace Job Modal should appear.
In the Act On tab…
“Select Documents” will be chosen by default. Click All Documents in Results List to instead replace all filtered documents that currently show in the Processing Grid.
Under the Settings tab…
Name your Replace job.
Decide whether to enable PST scan.
Decide whether to OCR during reprocessing, whether to index errors, and if this should apply to all PDFs.
Select an S3 Folder. This folder should contain exact copies of the documents you want reprocessed. Filenames must match in order to replace a document. If an errored file is named “Emails”, naming the identical, replacement file “Emails2” will prevent the document from being replaced.
Press SUBMIT.
A green popup box will acknowledge that your Replace job has been processed. Click View Job to jump to the Jobs screen, where you can see the status of your Replace jobs.
C) Approve the error
This will change your document status from errored to approved.
Choose which documents you want to approve from the Processing Grid. Either select individual documents using the check boxes, or perform a search to cull your data.
In the Processing Grid Toolbar, click Approve Errors.
The Approve Job Modal should appear.
In the Act On tab…
“Select Documents” will be chosen by default. Click All Documents in Results List to instead approve all filtered documents that currently show in the Processing Grid.
Under the Settings tab…
Name your Approve Errors job.
Provide the reason you are approving the files (e.g. “Corrupted files — no replacements available”)
Press SUBMIT.
A green popup box will acknowledge that your approve job has been processed. Click View Job to jump to the Jobs screen, where you can see the status of your Approve Errors jobs.
Errored documents that have been approved will contain a ![]() green circle icon with a check mark. Hovering over this icon will display the reason why the document was approved.
green circle icon with a check mark. Hovering over this icon will display the reason why the document was approved.
Search processed data
In-text and metadata searches can be performed on processed files to sort through your data; this search feature functions similarly to searching in the Review Grid, but is more limited. You can create saved searches, view search history (individual level only), and perform advanced searches using Boolean operators.
Export to CSV
Users can export files from the Processing Grid, deciding which fields to include in their exported spreadsheet. See Export Documents for further instructions.
Manage Field Profiles
Like the Review Grid, click the Default ⏷ dropdown and select Manage Field Profile to edit field profiles for the Processing Grid. See Customize Review for instructions on how to use the Manage Field Profile modal.
Promote to ECA or Review
Above the check boxes used to select documents, you can promote documents from the Review Grid so they are passed either to the ECA grid or Review grid.
Choose which documents you want to promote from the Processing Grid. Either select individual documents using the check boxes, or perform a search to cull your data.
In the Processing Grid Toolbar, click Promote.
The Promote Job Modal should appear.
In the Act On tab…
“Select Documents” will be chosen by default. Click All Documents in Results List to instead approve all filtered documents that currently show in the Processing Grid. Note that duplicate documents will be not be Promoted.
Under the Settings tab…
Name your promotion job.
Choose Promote to ECA or Promote to Review from the bulleted list.
Click SUBMIT.
A confirmation modal will appear. Click CONFIRM.
A green popup box will acknowledge that your promotion job has been processed. Click View Job to jump to the Jobs screen, where you can see the status of your promotion jobs.
Documents that have been promoted to ECA will display an ![]() Open Box icon in the Processing Grid, shown below.
Open Box icon in the Processing Grid, shown below.

For more information on the ECA Grid, see our ECA Grid article.
Demote documents back to Processing
Demoting documents from ECA back to the Processing Grid can only be done in the Processing Grid.
Choose which documents you want to demote from the ECA Grid. Either select individual documents using the check boxes, or perform a search to cull your data. You can reference the
.png) Open Box icons to see which documents are currently in the ECA grid.
Open Box icons to see which documents are currently in the ECA grid.In the Processing Grid Toolbar, click Demote.
The Demote from ECA modal should appear.
In the Act On tab…
“Select Documents” will be chosen by default. Click All Documents in Results List to instead approve all filtered documents that currently show in the Processing Grid.
Under the Settings tab…
Name your demotion job.
Click SUBMIT.
A confirmation modal will appear. Click CONFIRM.
A green popup box will acknowledge that your promotion job has been processed. Click View Job to jump to the Jobs screen, where you can see the status of your promotion jobs.
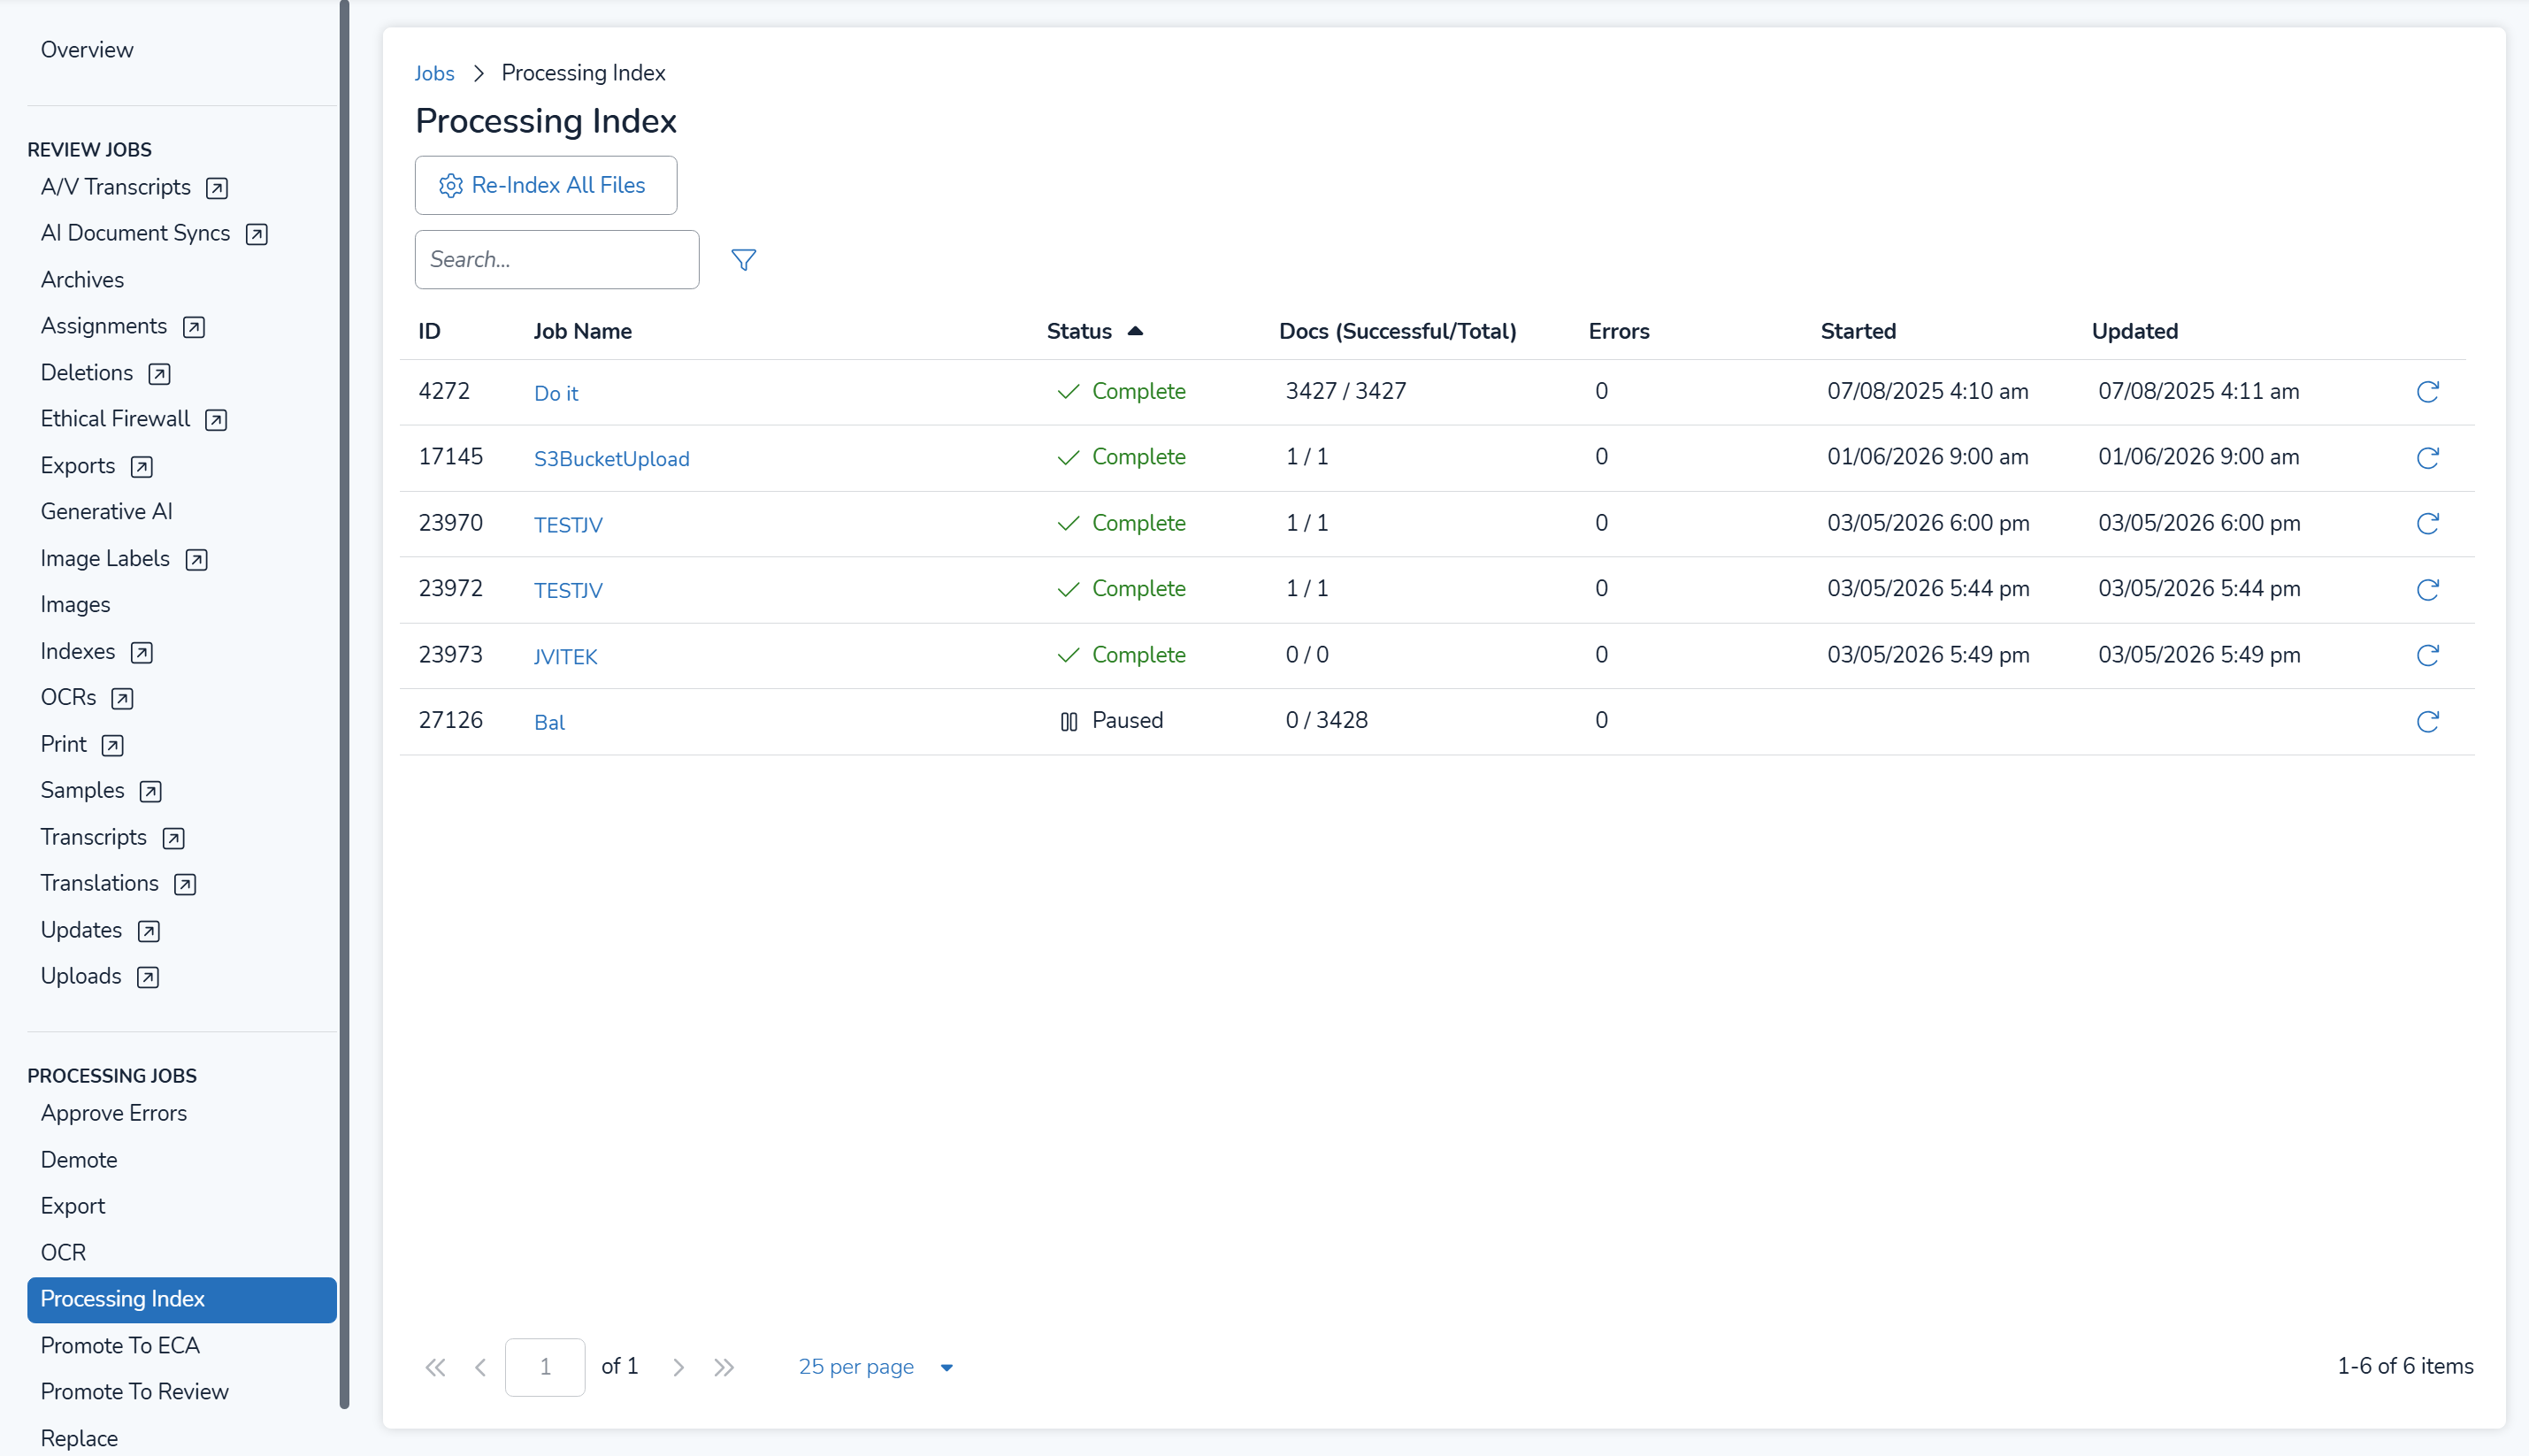
Processing Jobs page
In the Jobs screen, a new page group exists to view all the previously mentioned jobs – Approve Errors, Demote, Export, OCR, Promote to ECA or Promote to Review, Replace, and Reprocess.
The Processing Index page, allows for a full Re-Index of all files processed within a project, and can allow existing cases to have their processing grid appear. Here users can also re-index individual jobs by clicking the Re-index button ![]() .
.
Processing Settings
Under the Settings page, users can view and edit processing settings for their current project, just as they can in Reveal Processing.
The fields Data Filtering Operation, Excluded File Types, and NIST Documents are only editable upon project creation and cannot be edited after.
For detailed instructions on how to interact with this modal, see the Create a Template section in Instance Processing Overview Screen – Web.
.png)
Note
Any settings updated in the Edit Processing Settings modal will remain in effect for all future processing jobs within your current project.